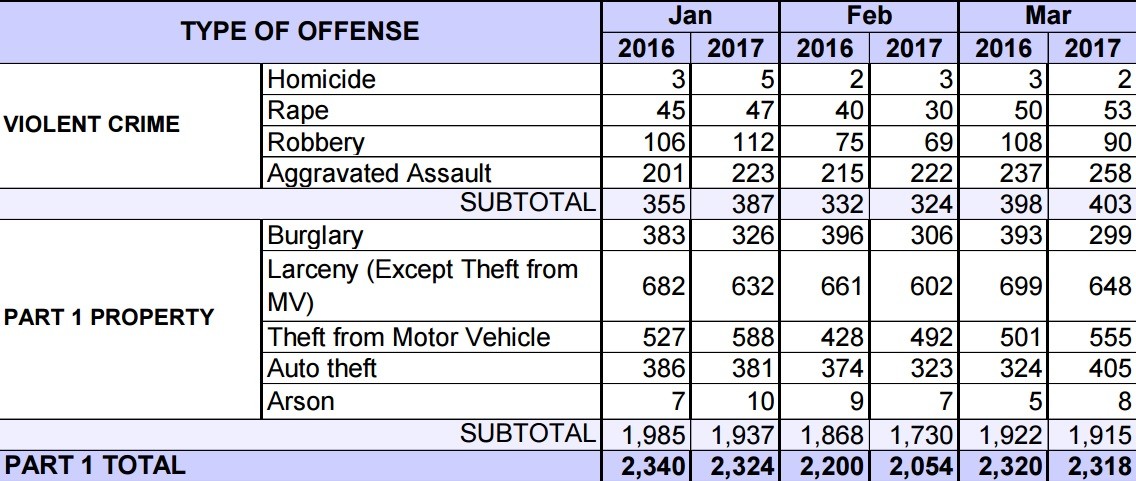
Overall, crime in Denver has dipped slightly over the past year according to DPD stats. As you can see in the graphic below, the total offenses in January, February and March (the most recent month for which figures are final) all fell from the same periods the year before, albeit by relatively small amounts.
However, there are exceptions in assorted categories — most notably homicides. During the first three months of 2016, eight homicides took place in Denver, while ten have happened this year, including five during the month of January alone. Additionally, there have been more aggravated assaults in each month of 2017 than during their counterparts in 2016.
Here are the latest digits:
When it comes to specific neighborhoods, the DPD tracks crimes with several online tools, including the Denver Crime Map, which allows users to choose a date range for specific spots. This week, we did so for the period between January 1 and April 16 and then compared the resulting stats to ones we shared in a 2015 post headlined "Ten Denver Neighborhoods With the Highest Crime Density So Far in 2015."
We've found that crime density, which measures offenses per square mile, tends to be a more useful metric than the actual number of infractions, since the size of neighborhoods in Denver varies so widely. For example, Gateway-Green Valley Ranch and Stapleton both have fairly high crime numbers: 402 and 622, respectively. But since they're so large, the crime density is actually quite low — 54.60 per square mile for Gateway-Green Valley Ranch, 69.24 per square mile for Stapleton.
Another factor to note: The offense count lumps together minor crimes and serious ones.
The stats in our 2015 post covered a longer period than this one, running from January 1 to May 11 of that year. However, the crime-density numbers can still be directly compared, and they show two neighborhoods dropping out of the top ten: Barnum, which finished tenth in 2015, and Cole, which came in at eighth. In addition, there's been some shifting among the other eight neighborhoods in terms of ranking.
Most important, though, are the density numbers, and they contain plenty of good news. Even the number-one neighborhood in both 2015 and 2017 has seen its crime-density numbers decline. But they've gone up for both the number two and four neighborhoods this year.
Here are the latest numbers, as juxtaposed with the ones from 2015.
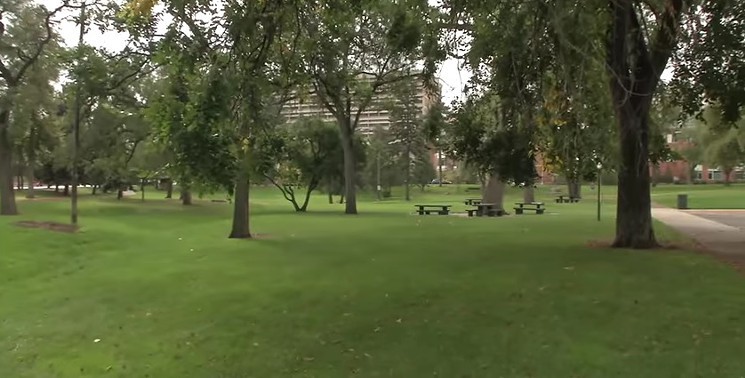
Lincoln Park neighborhood.
YouTube file photo
Crime Density, January 1-April 16, 2017: 335.42 per square mile
Offense Count, January 1-April 16, 2017: 428
Crime Density, January 1-May 11, 2015: 429.47 per square mile
Offense Count, January 1-May 11, 2015: 548
2015 ranking: Number 9
Number 9: Westwood

Crime Density, January 1-April 16, 2017: 340.01 per square mile
Offense Count, January 1-April 16, 2017: 509
2015 ranking: Outside the top ten
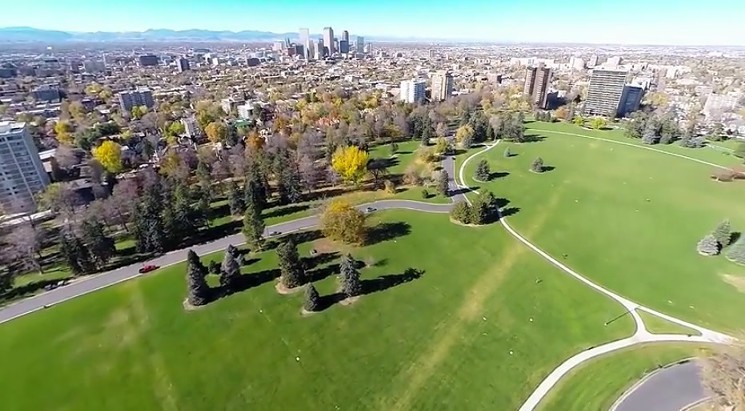
Cheesman Park neighborhood.
YouTube file photo
Crime Density, January 1-April 16, 2017: 417.46 per square mile
Offense Count, January 1-April 16, 2017: 220
Crime Density, January 1-May 11, 2015: 588.24 per square mile
Offense Count, January 1-May 11, 2015: 310
2015 ranking: Number 5
Number 7: City Park West

Crime Density, January 1-April 16, 2017: 442.99 per square mile
Offense Count, January 1-April 16, 2017: 237
2015 ranking: Outside the top ten
West Colfax neighborhood.
YouTube file photo
Crime Density, January 1-April 16, 2017: 464.14 per square mile
Offense Count, January 1-April 16, 2017: 466
Crime Density, January 1-May 11, 2015: 541.83 per square mile
Offense Count, January 1-May 11, 2015: 544
2015 ranking: Number 7
Continue to get information about the five Denver neighborhoods with the most crimes per square mile right now.

Five Points neighborhood.
YouTube file photo
Crime Density, January 1-April 16, 2017: 660.41 per square mile
Offense Count, January 1-April 16, 2017: 1,161
Crime Density, January 1-May 11, 2015: 787.26 per square mile
Offense Count, January 1-May 11, 2015: 1,384
2015 ranking: Number 4

East Colfax neighborhood.
YouTube file photo
Crime Density, January 1-April 16, 2017: 730.59 per square mile
Offense Count, January 1-April 16, 2017: 781
Offense Count, January 1-May 11, 2015: 594
Crime Density, January 1-May 11, 2015: 555.66 per square mile
2015 ranking: Number 6

Capitol Hill neighborhood.
YouTube file photo
Crime Density, January 1-April 16, 2017: 963.02 per square mile
Offense Count, January 1-April 16, 2017: 651
Crime Density, January 1-May 11, 2015: 1,100.59 per square mile
Offense Count, January 1-May 11, 2015: 744
2015 ranking: Number 2

Union Station neighborhood.
YouTube file photo
Crime density, January 1-April 16, 2017: 1,234.62 per square mile
Offense count, January 1-April 16, 2017: 542
Crime Density, January 1-May 11, 2015: 1,047.84 per square mile
Offense Count, January 1-May 11, 2015: 460
2015 ranking: Number 3

Central Business District neighborhood.
YouTube file photo
Crime density, January 1-April 16, 2017: 1,684.45 per square mile
Offense count, January 1-April 16, 2017: 726
Crime Density, January 1-May 11, 2015: 2273.78 per square mile
Offense Count, January 1-May 11, 2015: 980
2015 ranking: Number 1