In our recent post headlined "Exploding the Myths of Today's Denver Real Estate Market," Megan Aller, a sales representative for First American Title Insurance Corporation who's been working in the area for the past thirteen years or so, argued that housing experts who've declared that the Mile High City is shifting toward a buyer's market are overstating the current scenario.
But Aller also notes that Denver offers a slew of different housing options, with plenty of zip codes across the metro area offering greater affordability than many consumers realize.
And she's got the data to prove it.
Every month, Aller assembles a detailed report about the Denver real estate scene. The latest edition crunches numbers from October, supplemented by graphics, several of which are on view below, that offer fresh insight into the places where bargains are more likely to be found — or not.
For instance, she says, prices tend to be higher "closer to the city. If you're getting inside of central Denver, those land prices are going to be at a premium. But as you spread out from Denver along I-76 and north of I-70, and dipping down into Aurora, you're likely to find housing at less than the average price in metro Denver."
A lot less, in fact. According to Aller, "The average price in Denver is around $477,000 right now. But northeast or east of the city, you can find housing prices in zip codes that are just under $300,000."
The lowest prices during October could be found in and around Aurora. Aller specifically points to the 80012, 80014, 80017 and 80247 zip codes.
Get more details in words and text below.
As you can see, zip code averages for October ranged from $214,149 to $908,105. The places where the prices hovered closest to the bottom of the scale were mostly to the east, northeast and north of the metro area, with a scattering of mid-priced offerings west and southwest of the central city.
Outlying areas such as 80403, representing portions of Golden and Arvada, and 80439, which encompasses Evergreen and portions of both Jefferson and Clear Creek counties, were much pricier. But they couldn't compare with 80111, the home of Cherry Hills Village.
No matter the zip code, however, final prices in October tended to be very close to list. Indeed, the scale in this graphic begins at 97.2 percent, meaning that no zip codes routinely saw prices slip by more than 3 percent; 80439 was among the places that came closest.
As for the top end of the scale, it sits at 100.1 percent — an indication of zip codes where the average was above list. That was the case in 80249, whose neighborhoods include Gateway and Green Valley Ranch. The prices there were among the most reasonable in the city, hovering around $300,000. But this stat demonstrates that the list there is mighty solid these days.
The percentage of houses sold at close-to-list prices varies according to the type of property, with the largest variances shown in the above graphic at the top and bottom of the assorted categories.
There aren't many homes for sale for under $200,000 in metro Denver these days, but more than 5 percent of those that exist went for either considerably less or more than the initial tag. Likewise, luxury pads priced between $1 million and $3 million, as well as those going for $3 million or more, don't sell at or close to list price more than 2 percent of the time.
In the meantime, price reductions were more common during October than has been the case in many recent years. This graphic depicts zip codes where the lists were lowed in October — something that occurred from 15.9 percent to 60.6 percent of the time.
Price cuts happened less often in zip codes on the outer edges of the metro area, such as 80107, which includes Elizabeth and Ponderosa Park. In contrast, well over half of the list prices were reduced in 80125, long a popular suburban destination; Roxborough Park, Highlands Ranch and Littleton are among its communities.
Likewise, the percentage of price reductions rose. This graphic reveals that 36.8 percent of listings in October saw price reductions.
That number is nowhere near the 60 percent seen in Denver back in December 2010, during the peak of the Great Recession. But it's up by 16.9 percent from this time last year.
Here are some other key facts from Aller's October report.
Detached Single Family:
• Active inventory for October down by -13.4 percent from the previous month and down -18.4 percent from the same month one year ago, 4,941. Contracts accepted also declined month over month by -3.5 percent but is up a significant amount, 11.6 percent from the same month one year ago, or 3,412 units.
• Days on market steady at 32 average days to contract, or 16 median days to contract. Both metrics continue to report at a slightly higher value than the previous 7 years in this cycle.
• Home prices usually peak annually in either May or June. This year the peak was in May, and prices pulled back from June through September. In October the average sold price was $522,741, which is an increase by 0.7 percent from the previous month, and up 1.3 percent YOY. Median sold price was also up 1.1 percent from September, and still up 4.7 percent over the same month last year to $450,000.
• Close to list price ratio steady in October at 99.0%. Original to Sold price ratio was down from the last month at 97.2 percent. Both metrics are likely to decline through the end of the year, giving buyers more negotiating power in the last quarter of 2019.
• Flash sales, or units under contract in the first weekend, consistent with last month in October. The number of units under contract in 7 days or less was 34.5 percent.
• 48.1 percent of homes closed in October sold for at or over their asking price.
Attached Single Family:
• Active down from the previous month in October 2019 to 2,463 units for sale. This represents a 7.0 percent increase over the same month one year ago. Contracts written are also up YOY, by 10.8 percent or 1,351 units. Even with increasing inventory, buyer demand continues to favor the seller.
• Days on market were constant, holding at 35 average days to contract or 18 median days to contract. Days on market are up YOY 40.0 percent and 38.5 percent, respectively.
• Average sold price up MOM by 3.1% to $361,553. However the median sold price was down from last month to $300,000 by -3.2 percent.
• Close to list price ratios steady at 98.9 percent of the last asking price.
• Flash sales, or units under contract in the first weekend, declined MOM in October to 30.4 percent. This metric will continue to ease into the end of the year.
• 47.6 percent of homes sold in October sold for at or over their asking price.
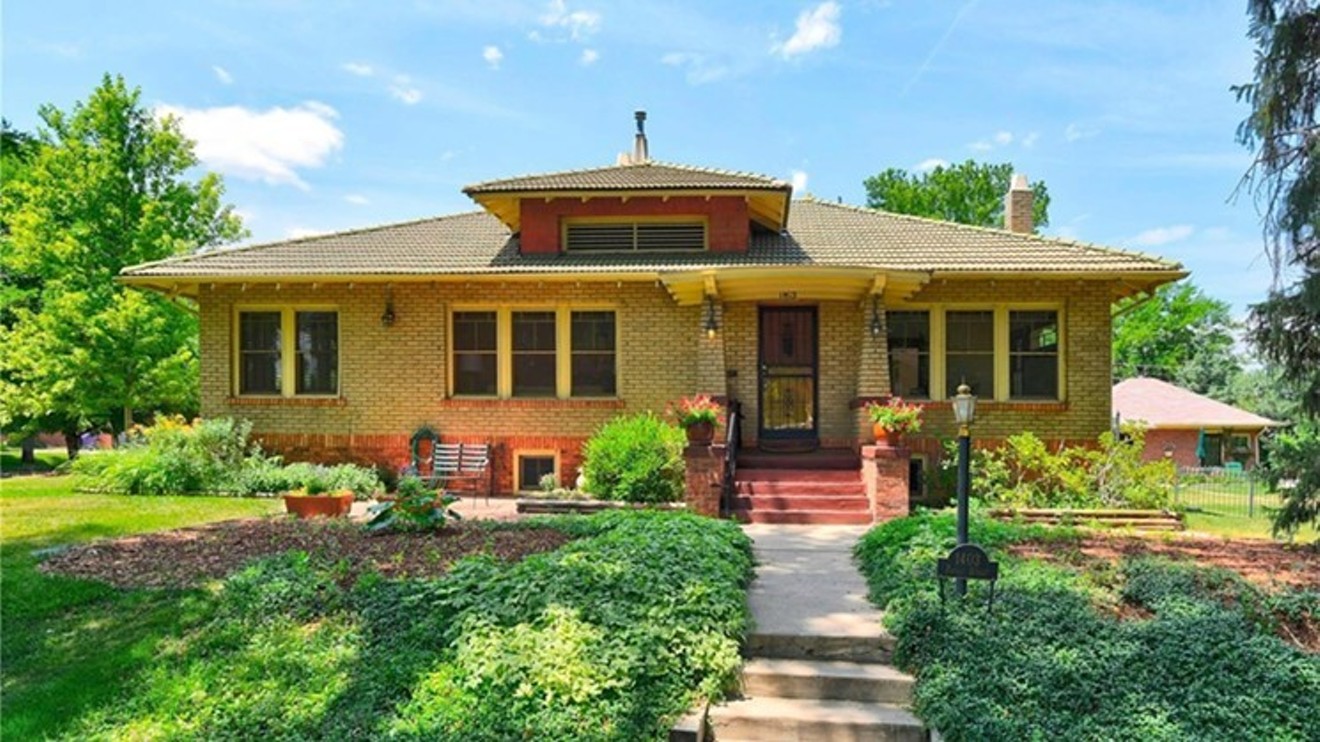
This five-bedroom, 4,246-square-foot home at 1403 Forest Street in Denver, set on a 16,610-foot lot that also includes three other buildings, sold for $1 million in December 2017.
Kentwood Co at Cherry Creek file photo
[
        {
          "name": "Air - MediumRectangle - Inline Content - Mobile Display Size",
          "component": "12017618",
          "insertPoint": "2",
          "requiredCountToDisplay": "2"
        },{
          "name": "Editor Picks",
          "component": "17242653",
          "insertPoint": "4",
          "requiredCountToDisplay": "1"
        },{
          "name": "Inline Links",
          "component": "18838239",
          "insertPoint": "8th",
          "startingPoint": 8,
          "requiredCountToDisplay": "7",
          "maxInsertions": 25
        },{
          "name": "Air - MediumRectangle - Combo - Inline Content",
          "component": "17261320",
          "insertPoint": "8th",
          "startingPoint": 8,
          "requiredCountToDisplay": "7",
          "maxInsertions": 25
        },{
          "name": "Inline Links",
          "component": "18838239",
          "insertPoint": "8th",
          "startingPoint": 12,
          "requiredCountToDisplay": "11",
          "maxInsertions": 25
        },{
          "name": "Air - Leaderboard Tower - Combo - Inline Content",
          "component": "17261321",
          "insertPoint": "8th",
          "startingPoint": 12,
          "requiredCountToDisplay": "11",
          "maxInsertions": 25
        }
      ]


KEEP WESTWORD FREE...
Since we started Westword, it has been defined as the free, independent voice of Denver, and we'd like to keep it that way. Your membership allows us to continue offering readers access to our incisive coverage of local news, food, and culture with no paywalls.
You can support us by joining as a member for as little as $1.


Trending


Use of this website constitutes acceptance of our
terms of use,
our cookies policy, and our
privacy policy
Westword may earn a portion of sales from products & services purchased through links on our site from our
affiliate partners.
©2024
Denver Westword, LLC. All rights reserved.
Do Not Sell or Share My Information
Do Not Sell or Share My Information
