Denver has a national reputation as a great biking city, but in recent years, cycling advocates such as Denver Cruisers founder Brad Evans have acknowledged that it can be scary to ride bikes in the Mile High City given factors such as explosive growth, increasing traffic congestion and incidents of bike rage.
To find out the areas of greatest risk for cyclists, we dug into the facts and figures collected in Denver's open data catalogue, a free online resource. There, visitors will find traffic information dating back to 2012 — and stats for more recent incidents are accessible within a week or two of their occurrence.
We discovered that there were 2,054 reports of accidents involving cars striking bicycles (or vice versa) from the start of the database to April 19 of this year. Over that period, the most crashes of this type by far tended to take place in central Denver neighborhoods, including Capitol Hill, North Capitol Hill, Union Station and Civic Center. But another neighborhood that's easy pedaling distance to downtown topped these areas by a substantial margin.
Count down the top ten below, supplemented by details about the first listed crash in each area and the most recent one. We've also added notes about incidents that involved special circumstances, such as serious bodily injuries or hit-and-runs.
Number 10: Speer
Number of car-bicycle accidents from 2012 to April 19, 2018: 59
First listed incident:
01/18/12
E SPEER BLVD/N LINCOLN ST
Note: Two bicyclists involved
Most recent incident:
04/04/18
E 5TH AVE/N DOWNING ST
Number 9: City Park West
Number of car-bicycle accidents from 2012 to April 19, 2018: 59
First listed incident:
05/25/12
E 17TH AVE/N GAYLORD ST
Most recent incident:
01/04/18
N LAFAYETTE ST/E COLFAX AVE
Number 8: Highland
Number of car-bicycle accidents from 2012 to April 19, 2018: 63
First listed incident:
09/04/12
W 35TH AVE/N ELIOT ST
Most recent incident:
03/09/18
W 35TH AVE/ N VALLEJO ST
Number 7: Lincoln Park

Number of car-bicycle accidents from 2012 to April 19, 2018: 73
First listed incident:
06/04/12
800 BLOCK W 14TH AVE
Most recent incident:
11/02/17
W COLFAX AVE/I25 HWYNB
Note: Serious bodily injury
Number 6: Civic Center
Number of car-bicycle accidents from 2012 to April 19, 2018: 78
First listed incident:
09/19/12
900 BLOCK N ACOMA ST
Note: Hit-and-run
Most recent incident:
04/18/18
W COLFAX AVE/COURT PL
Note: Hit-and-run

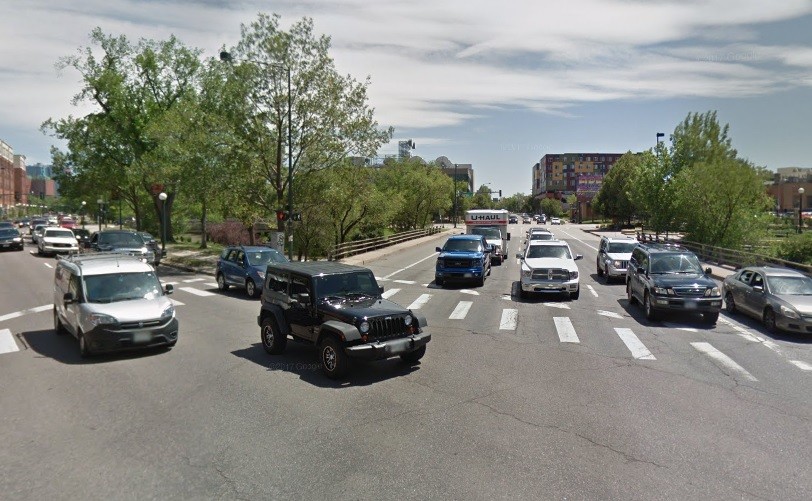
Looking down the 1500 block of North Pearl Street.
Google Maps
Number of car-bicycle accidents from 2012 to April 19, 2018: 89
First listed incident:
03/25/12
1500 BLOCK N PEARL ST
Note: DUI/DUID
Most recent incident:
01/31/18
18 E 16TH AVE/N PEARL ST
Number 4: Union Station
Number of car-bicycle accidents from 2012 to April 19, 2018: 94
First listed incident:
04/13/12
20TH ST/MARKET ST
Most recent incident:
04/07/18
19TH ST/MARKET ST
Number 3: CBD (Central Business District)
Number of car-bicycle accidents from 2012 to April 19, 2018: 99
First listed incident:
04/11/12
15TH ST/COURT PL
Most recent incident:
04/19/18
600 BLOCK 17TH ST
Note: Hit-and-run
Number 2: Capitol Hill

Number of car-bicycle accidents from 2012 to April 19, 2018: 111
First listed incident:
09/18/12
E 11TH AVE/N LINCOLN ST
Most recent incident:
01/10/18
E 12TH AVE/N LINCOLN ST
Number 1: Five Points
Number of car-bicycle accidents from 2012 to April 19, 2018: 133
First listed incident:
06/11/12
CALIFORNIA ST/27TH ST
Note: Hit-and-run
Most recent incident:
03/05/18
300 BLOCK PARK AVE W