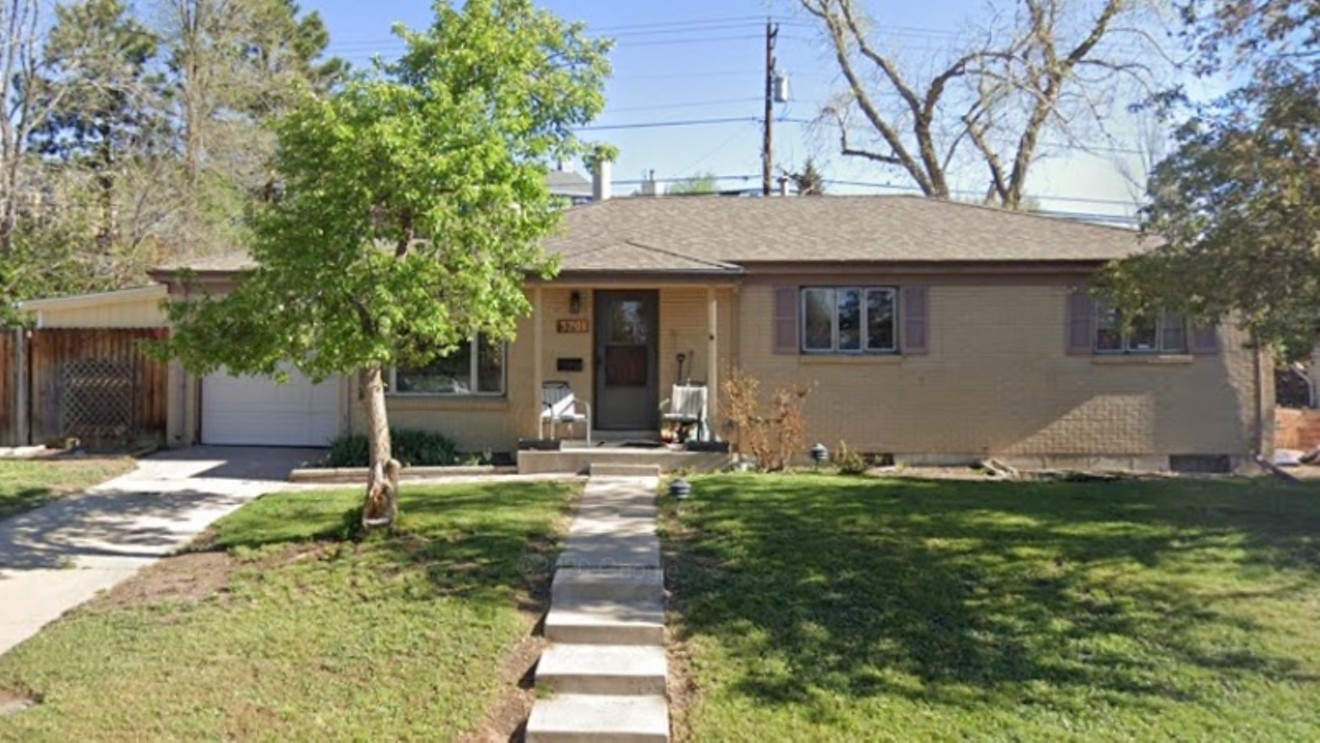
But these developments haven't taken place in a vacuum. Over the past five years, the median price for homes in the heart of metro Denver has gone up by nearly 35 percent. And while common wisdom suggests that this year's jump was fueled mainly by inventory shortages, figures assembled for Westword show that there have been many more homes for sale in 2020 than during 2015, when the market was among the hottest in the country — but incredible demand has resulted in them being snapped up almost as soon as they're listed.
The stats shared here were compiled by Jim Smith of Golden Real Estate, a longtime local broker spotlighted in our recent post explaining how the novel coronavirus is putting a damper on condo sales. Using figures from REcolorado, Smith culled data intended to give a better idea of the market specific to Denver.
The federally defined Denver metropolitan statistical area, or MSA, actually consists of eleven counties, including such outlying regions such as Elbert, Clear Creek, Gilpin and Park counties. But Smith zeroed in on the zone within a 25-mile radius of the State Capitol. Moreover, he focused not on the average price of homes, which he sees as being inflated by the most expensive properties, but on the median price, smack dab in the middle of all houses sold during any particular period. Smith sees median price as a truer indication of what a buyer is likely to encounter.
Using this treasure trove of stats, we juxtaposed the first ten months of both 2015 and 2020 (January through October, the most recent month for which numbers are available), and the differences are striking. There were thousands more active listings, pending listings and new listings this year than in 2015, especially throughout the winter and spring months, when the volume of buying is traditionally lower than during the peak summer season. Total sales numbers for 2020 were much higher over that ten-month span, too — and sales were steady into the summer and even the fall, when the pace usually slows. Note that total sales in October 2020 were 6,680, compared to 4,793 for the same month in 2015.
The same contrast between 2020 and 2015 holds for median sold prices, which have hit a different level of the stratosphere every month this year, from January ($281,750 in 2015, $420,000 in 2020) to October ($309,900 in 2015, $475,000 in 2020).
See how things have changed below. (By the way, Smith notes that the metric Price/Fin. SF translates to "price per finished square foot. Finished square foot includes the above-grade square footage plus any square footage below grade that is finished.")
January 2015:
Active Listings: 5,479
Pending Listings: 3,480
New Listings: 3,807
Total Sales: 2,552
Median Sold Price: $281,750
Cash Sales: 483
Cash Median Price: $242,000
Price/Fin. SF: $152
Days in MLS: 12
Sold Ratio: 99.7 percent
Months of Inventory: 2
January 2020:
Active Listings: 8,024
Pending Listings: 4,726
New Listings: 5,649
Total Sales: 3,578
Median Sold Price: $420,000
Cash Sales: 471
Cash Median Price: $383,940
Price/Fin. SF: $223
Days in MLS: 27
Sold Ratio:99.2 percent
Months of Inventory: 2
February 2015:
Active Listings: 5,402
Pending Listings: 3,966
New Listings: 4,288
Total Sales: 2,998
Median Sold Price: $294,995
Cash Sales: 661
Cash Median Price: $257,000
Price/Fin. SF: $159
Days in MLS: 8
Sold Ratio: 100.0 percent
Months of Inventory: 2
February 2020:
Active Listings: 8,150
Pending Listings: 4,672
New Listings: 5,821
Total Sales: 4,081
Median Sold Price: $426,250
Cash Sales: 530
Cash Median Price: $417,775
Price/Fin. SF: $228
Days in MLS: 12
Sold Ratio: 100.0 percent
Months of Inventory: 2
March 2015:
Active Listings: 5,703
Pending Listings: 5,146
New Listings: 5,913
Total Sales: 4,247
Median Sold Price: $312,400
Cash Sales: 802
Cash Median Price: $265,000
Price/Fin. SF: $163
Days in MLS: 5
Sold Ratio: 100 percent
Months of Inventory: 1
March 2020:
Active Listings: 9,534
Pending Listings: 4,745
New Listings: 7,612
Total Sales: 5,112
Median Sold Price: $449,000
Cash Sales: 593
Cash Median Price: $436,776
Price/Fin. SF: $234
Days in MLS: 7
Sold Ratio: 100 percent
Months of Inventory: 2
April 2015:
Active Listings: 6,685
Pending Listings: 5,494
New Listings: 7,077
Total Sales: 4,711
Median Sold Price: $315,000
Cash Sales: 859
Cash Median Price: $282,000
Price/Fin. SF: $164
Days in MLS: 5
Sold Ratio: 100 percent
Months of Inventory: 1
April 2020:
Active Listings: 10,484
Pending Listings: 3,298
New Listings: 5,490
Total Sales: 4,122
Median Sold Price: $445,000
Cash Sales: 389
Cash Median Price: $437,000
Price/Fin. SF: $235
Days in MLS: 5
Sold Ratio: 100 percent
Months of Inventory: 3
May 2015:
Active Listings: 7,208
Pending Listings: 5,802
New Listings: 6,966
Total Sales: 5,142
Median Sold Price: $323,000
Cash Sales: 908
Cash Median Price: $283,050
Price/Fin. SF: $166
Days in MLS: 5
Sold Ratio: 100 percent
Months of Inventory: 1
May 2020:
Active Listings: 10,956
Pending Listings: 6,818
New Listings: 8,297
Total Sales: 3,740
Median Sold Price: $440,000
Cash Sales: 416
Cash Median Price: $430,000
Price/Fin. SF: $230
Days in MLS: 9
Sold Ratio: 100 percent
Months of Inventory: 3
June 2015:
Active Listings: 7,981
Pending Listings: 5,651
New Listings: 7,068
Total Sales: 5,974
Median Sold Price: $325,000
Cash Sales: 1,019
Cash Median Price: $300,500
Price/Fin. SF: $168
Days in MLS: 6
Sold Ratio: 100 percent
Months of Inventory: 1
June 2020:
Active Listings: 10,248
Pending Listings: 7,633
New Listings: 8,392
Total Sales: 6,547
Median Sold Price: $450,000
Cash Sales: 694
Cash Median Price: $441,994
Price/Fin. SF: $235
Days in MLS: 9
Sold Ratio: 100 percent
Months of Inventory: 2
July 2015:
Active Listings: 9,121
Pending Listings: 5,419
New Listings: 7,424
Total Sales: 5,939
Median Sold Price: $312,000
Cash Sales: 973
Cash Median Price: $290,000
Price/Fin. SF: $169
Days in MLS: 6
Sold Ratio: 100 percent
Months of Inventory: 2
July 2020:
Active Listings: 10,133
Pending Listings: 6,951
New Listings: 8,586
Total Sales: 7,686
Median Sold Price: $460,000
Cash Sales: 817
Cash Median Price: $475,000
Price/Fin. SF: $236
Days in MLS: 7
Sold Ratio: 100 percent
Months of Inventory: 1
August 2015:
Active Listings: 9,282
Pending Listings: 5,365
New Listings: 6,395
Total Sales: 5,309
Median Sold Price: $315,000
Cash Sales: 878
Cash Median Price: $296,000
Price/Fin. SF: $168
Days in MLS: 7
Sold Ratio: 100 percent
Months of Inventory: 2
August 2020:
Active Listings: 9,132
Pending Listings: 7,284
New Listings: 7,772
Total Sales: 6,868
Median Sold Price: $460,000
Cash Sales: 811
Cash Median Price: $458,000
Price/Fin. SF: $237
Days in MLS: 7
Sold Ratio: 100 percent
Months of Inventory: 1
September 2015:
Active Listings: 9,267
Pending Listings: 4,740
New Listings: 5,894
Total Sales: 5,100
Median Sold Price: $305,450
Cash Sales: 838
Cash Median Price: $275,000
Price/Fin. SF: $169
Days in MLS: 8
Sold Ratio: 100 percent
Months of Inventory: 2
September 2020:
Active Listings: 8,579
Pending Listings: 6,282
New Listings: 7,317
Total Sales: 6,749
Median Sold Price: $460,000
Cash Sales: 858
Cash Median Price: $450,250
Price/Fin. SF: $240
Days in MLS: 6
Sold Ratio: 100 percent
Months of Inventory: 1
October 2015:
Active Listings: 8,828
Pending Listings: 4,750
New Listings: 5,541
Total Sales: 4,793
Median Sold Price: $309,900
Cash Sales: 769
Cash Median Price: $280,000
Price/Fin. SF: $168
Days in MLS: 10
Sold Ratio: 100 percent
Months of Inventory: 2
October 2020:
Active Listings: 7,331
Pending Listings: 6,263
New Listings: 7,091
Total Sales: 6,680
Median Sold Price: $475,000
Cash Sales: 918
Cash Median Price: $486,776
Price/Fin. SF: $244
Days in MLS: 7
Sold Ratio: 100 percent
Months of Inventory: 1


