A new study estimates that it will take 83 percent of Denver millennial renters twenty years or more to save enough for a 20 percent down payment on a median-priced condo at current market value.
That's the longest wait for the highest percentage of millennial renters living in any of America's twenty largest cities, and it makes the goal of home ownership an impossible one for many residents of the Mile High.
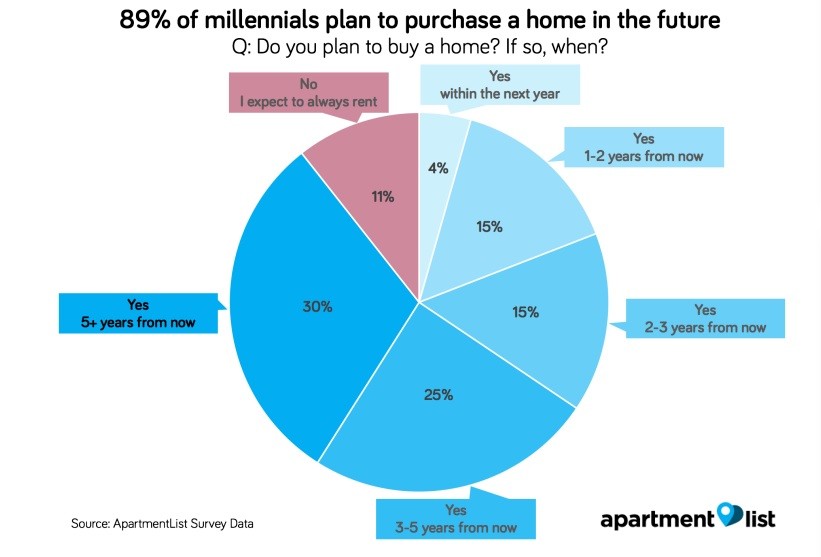
The grim news is delivered by Apartment List in "2018 Millennial Homeownership Report: American Dream Delayed," a report whose co-author, Rob Warnock, supplied Westword with the statistical breakdown on view below. As you'll see, the figures are even more dire than they were in June 2017, when a previous Apartment List survey calculated that it would take most Denver millennials sixteen years to afford a down payment on a home.
While the situation in Denver is the most extreme among any of the biggest U.S. metros, it's indicative of a common issue for today's young renters.
According to data gathered by Warnock and fellow author Chris Salviati and illustrated in graphics seen here, nine out of ten millennial renters want to buy a home of their own, but just 4.9 percent think it's possible to do so within the next year. That's because 72 percent of millennial renters with home-buying on their mind are putting off a purchase because they simply can't afford it — and 62 percent pinpoint an inability to come up with enough folding green for a down payment as the reason.
That's no surprise. After all, Warnock and Salviati note that 48 percent of millennial renters have no savings set aside for a down payment on a home, and only 11 percent have set aside $10,000 or more for this purpose. Hence, around two-thirds of millennial renters will need two decades or more to collect the cash necessary for a 20 percent down payment on an average condo in their city, let alone a standalone house.
The situation is worse in major cities, where the cost of living is often higher than in smaller communities. In twelve of the twenty municipalities on the Apartment List roster, the number of millennial renters thought to need at least two decades to cobble together a down payment exceeds the two-thirds mark, with Denver winding up at the barrel's bottom in this respect.
Continue to count down the stats for millennial renters in the nation's twenty most populous cities, ranked from the lowest to the highest percentage for estimates of twenty years or more to afford a 20 percent down payment.
ESTIMATED YEARS NEEDED TO SAVE FOR 20 PERCENT DOWN PAYMENT
Number 20: Miami, Florida
20 years or more: 50.5 percent
10-20 years: 18.1 percent
5-10 years: 17.1 percent
Less than 5 years: 14.3 percent
Number 19: Philadelphia, Pennsylvania
20 years or more: 59.8 percent
10-20 years: 17.1 percent
5-10 years: 8.5 percent
Less than 5 years: 14.5 percent
Number 18: Orlando, Florida
20 years or more: 60.8 percent
10-20 years: 13.5 percent
5-10 years: 12.2 percent
Less than 5 years: 13.5 percent
Number 17: Chicago, Illinois
20 years or more: 62.8 percent
10-20 years: 6.6 percent
5-10 years: 14.6 percent
Less than 5 years: 16.1 percent
Number 16: Charlotte, North Carolina
20 years or more: 62.9 percent
10-20 years: 9.7 percent
5-10 years: 14.5 percent
Less than 5 years: 12.9 percent
Number 15: New York, New York
20 years or more: 63.0 percent
10-20 years: 10.9 percent
5-10 years: 11.4 percent
Less than 5 years: 14.7 percent
Number 14: Houston, Texas
20 years or more: 64.5 percent
10-20 years: 7.5 percent
5-10 years: 9.7 percent
Less than 5 years: 18.3 percent
Number 13: Portland, Oregon
20 years or more: 66.7 percent
10-20 years: 14.8 percent
5-10 years: 16.7 percent
Less than 5 years: 1.9 percent
Number 12: Minneapolis, Minnesota
20 years or more: 67.4 percent
10-20 years: 16.3 percent
5-10 years: 12.8 percent
Less than 5 years: 3.5 percent
Number 11: Dallas, Texas
20 years or more: 67.7 percent
10-20 years: 15.0 percent
5-10 years: 11.3 percent
Less than 5 years: 6.0 percent
Number 10: Atlanta,Georgia
20 years or more: 68.0 percent
10-20 years: 13.4 percent
5-10 years: 10.3 percent
Less than 5 years: 8.2 percent
Number 9: Los Angeles, California
20 years or more: 69.0 percent
10-20 years: 14.2 percent
5-10 years: 9.1 percent
Less than 5 years: 7.6 percent
Number 8: Washington, D.C.
20 years or more: 70.7 percent
10-20 years: 6.4 percent
5-10 years: 8.6 percent
Less than 5 years: 14.3 percent
Number 7: Phoenix, Arizona
20 years or more: 71.1 percent
10-20 years: 11.1 percent
5-10 years: 8.9 percent
Less than 5 years: 8.9 percent
Number 6: Seattle, Washington
20 years or more: 73.8 percent
10-20 years: 4.8 percent
5-10 years: 7.1 percent
Less than 5 years: 14.3 percent
Number 5: Boston, Massachusetts
20 years or more: 75.0 percent
10-20 years: 13.4 percent
5-10 years: 6.3 percent
Less than 5 years: 5.4 percent
Number 4: Austin, Texas
20 years or more: 77.3 percent
10-20 years: 9.1 percent
5-10 years: 1.5 percent
Less than 5 years: 12.1 percent
Number 3: San Diego, California
20 years or more: 79.5 percent
10-20 years: 8.4 percent
5-10 years: 4.8 percent
Less than 5 years: 7.2 percent
Number 2: San Francisco, California
20 years or more: 82.3 percent
10-20 years: 9.7 percent
5-10 years: 1.6 percent
Less than 5 years: 6.5 percent
Number 1: Denver, Colorado
20 years or more: 83.3 percent
10-20 years: 9.7 percent
5-10 years: 2.8 percent
Less than 5 years: 4.2 percent

Thinkstock file photo
[
        {
          "name": "Air - MediumRectangle - Inline Content - Mobile Display Size",
          "component": "12017618",
          "insertPoint": "2",
          "requiredCountToDisplay": "2"
        },{
          "name": "Editor Picks",
          "component": "17242653",
          "insertPoint": "4",
          "requiredCountToDisplay": "1"
        },{
          "name": "Inline Links",
          "component": "18838239",
          "insertPoint": "8th",
          "startingPoint": 8,
          "requiredCountToDisplay": "7",
          "maxInsertions": 25
        },{
          "name": "Air - MediumRectangle - Combo - Inline Content",
          "component": "17261320",
          "insertPoint": "8th",
          "startingPoint": 8,
          "requiredCountToDisplay": "7",
          "maxInsertions": 25
        },{
          "name": "Inline Links",
          "component": "18838239",
          "insertPoint": "8th",
          "startingPoint": 12,
          "requiredCountToDisplay": "11",
          "maxInsertions": 25
        },{
          "name": "Air - Leaderboard Tower - Combo - Inline Content",
          "component": "17261321",
          "insertPoint": "8th",
          "startingPoint": 12,
          "requiredCountToDisplay": "11",
          "maxInsertions": 25
        }
      ]


KEEP WESTWORD FREE...
Since we started Westword, it has been defined as the free, independent voice of Denver, and we'd like to keep it that way. Your membership allows us to continue offering readers access to our incisive coverage of local news, food, and culture with no paywalls.
You can support us by joining as a member for as little as $1.


Trending


Use of this website constitutes acceptance of our
terms of use,
our cookies policy, and our
privacy policy
Westword may earn a portion of sales from products & services purchased through links on our site from our
affiliate partners.
©2024
Denver Westword, LLC. All rights reserved.
Do Not Sell or Share My Information
Do Not Sell or Share My Information
