

Visit Denver via YouTube

Audio By Carbonatix
Today, November 20, Denver and at least fourteen other counties in the state will move to Level Red on the dial dashboard developed by the Colorado Department of Public Health and Environment for the fight against COVID-19 – a standard that stops short of requiring a non-essential business lockdown but includes tightened restrictions, such as a temporary end to inside dining at restaurants and an 8 p.m. last call.
The main data point that pushed Denver into this category was the two-week cumulative incidence of positive COVID-19 cases; the threshold to stay out of the red is 350, and the Mile High City currently sits at 1,183.3. But also important to the determination is the two-week average positivity rate – arguably the least understood metric related to the novel coronavirus, but also one that offers at least a sliver of good news.
How so? Right now, the majority of Denver’s 78 neighborhoods aren’t in Level Red for positivity – though all but three are past the 5 percent mark that concerns officials.
Because positivity rate is frequently confused with case rate, we asked Jennifer Fine, spokesperson for Denver Public Health, which maintains the indispensable Denver COVID-19 data summary page, to explain the difference. According to Fine, the case rate is found by “calculating the number of people infected with COVID-19 during a specific time frame relative to the total population of that geographic area. If you see a case rate of 200/100,000, it means that for every 100,000 people that live in that geographic area, 200 of them have COVID-19 during that specific time period.”
The positivity rate, meanwhile, is determined by “calculating the number of people that tested positive for COVID-19 during a specific time frame relative to the total number of people tested during that same time,” Fine explains. “If you see a positivity of 10 percent, that means that during that specified time frame, 10 percent of the people who were tested for COVID-19 tested positive and 90 percent tested negative.”
The World Health Organization considers a positivity rate of more than 5 percent to be a warning sign, and the only three Denver neighborhoods measuring under that are Wellshire (4.3 percent), Central Park, formerly Stapleton (4.5 percent), and the Central Business District, also known as the CBD (4.8 percent).
The CDPHE considers a county to be at Level Red if the positivity rate exceeds 15 percent, and Denver as a whole is just beneath that line, at 12.3 percent – and 56 of 78 neighborhoods are below the 15 percent level, too. Trouble is, the positivity rates in the remaining 22 neighborhoods are astronomical, ranging from 16.0 percent in Bear Valley to 28.7 percent in Valverde, whose total is likely boosted by the large number of hard-hit nursing homes in the area.
An important note: A city’s positivity rate doesn’t have to be in the red for the CDPHE to push it into that territory. Indeed, the CDPHE’s current standard for the Level Red positivity rate reads “no limit.” Instead, the positivity rate is considered in concert with the two-week cumulative incidence of positive cases. But the fact that the positivity rate for most of Denver is shy of the Red zone represents a ray of hope that the dire situation in which the city finds itself isn’t necessarily a permanent condition.
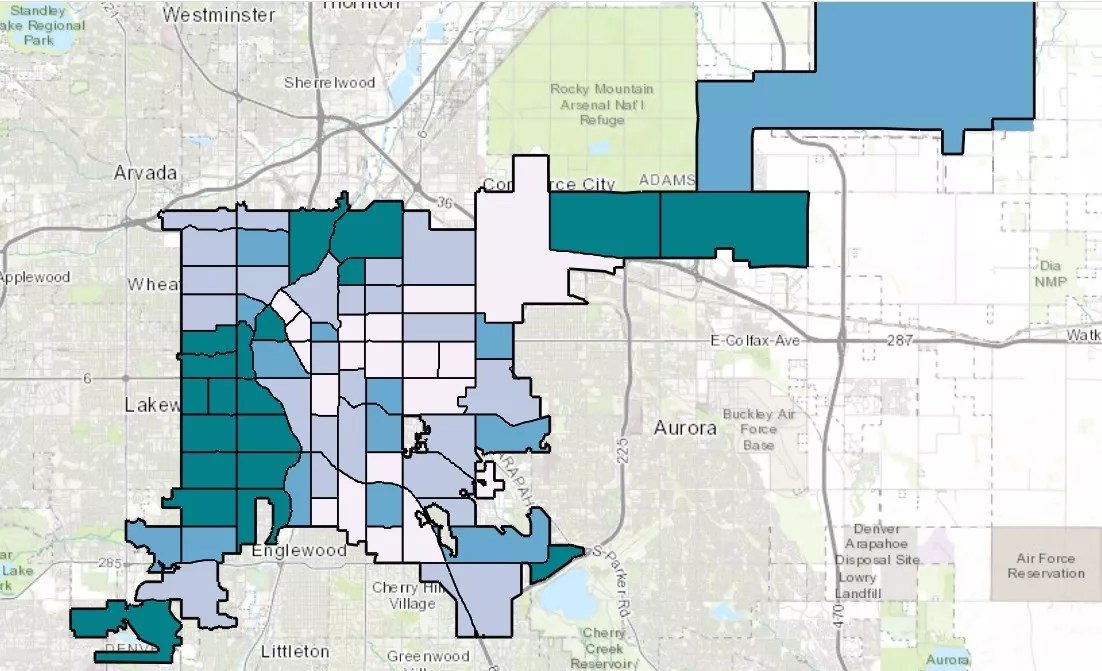
The Denver neighborhood positivity rate map as of November 20, 2020.
Here are the two-week average positivity rates for every Denver neighborhood, listed in ascending order:
Wellshire
Testing Positivity 4.3 percent
Central Park
Testing Positivity 4.5 percent
CBD
Testing Positivity 4.8 percent
Rosedale
Testing Positivity 5.3 percent
Union Station
Testing Positivity 5.7 percent
Cory – Merrill
Testing Positivity 6.3 percent
City Park
Testing Positivity 6.5 percent
Congress Park
Testing Positivity 6.5 percent
Montclair
Testing Positivity 6.5 percent
Hilltop
Testing Positivity 6.6 percent
University
Testing Positivity 6.9 percent
City Park West
Testing Positivity 6.9 percent
Hale
Testing Positivity 7.2 percent
Speer
Testing Positivity 7.2 percent
Indian Creek
Testing Positivity 7.2 percent
Civic Center
Testing Positivity 7.8 percent
University Hills
Testing Positivity 8.1 percent
North Park Hill
Testing Positivity 8.2 percent
Cheesman Park
Testing Positivity 8.3 percent
South Park Hill
Testing Positivity 8.6 percent
Platt Park
Testing Positivity 8.8 percent
Goldsmith
Testing Positivity 8.8 percent
Southmoor Park
Testing Positivity 8.8 percent
Baker
Testing Positivity 9.3 percent
Five Points
Testing Positivity 9.7 percent
Lowry Field
Testing Positivity 9.7 percent
Washington Park
Testing Positivity 9.8 percent
Fort Logan
Testing Positivity 9.8 percent
Hampden South
Testing Positivity 9.9 percent
Northeast Park Hill
Testing Positivity 10.2 percent
Highland
Testing Positivity 10.2 percent
Berkeley
Testing Positivity 10.3 percent
Virginia Village
Testing Positivity 10.4 percent
Regis
Testing Positivity 10.4 percent
Country Club
Testing Positivity 11.1 percent
Chaffee Park
Testing Positivity 11.1 percent
Skyland
Testing Positivity 11.1 percent
Capitol Hill
Testing Positivity 11.1 percent
West Highland
Testing Positivity 11.2 percent
Whittier
Testing Positivity 11.3 percent
Washington Park West
Testing Positivity 11.3 percent
Clayton
Testing Positivity 11.6 percent
Washington Virginia Vale
Testing Positivity 11.7 percent
Sloan’s Lake
Testing Positivity 11.9 percent
Sunnyside
Testing Positivity 12.1 percent
Overland
Testing Positivity 12.2 percent
University Park
Testing Positivity 12.5 percent
North Capitol Hill
Testing Positivity 12.6 percent
Belcaro
Testing Positivity 12.8 percent
DIA
Testing Positivity 12.8 percent
East Colfax
Testing Positivity 13.0 percent
Hampden
Testing Positivity 13.7 percent
Cherry Creek
Testing Positivity 14.1 percent
Jefferson Park
Testing Positivity 14.2 percent
Lincoln Park
Testing Positivity 14.3 percent
Windsor
Testing Positivity 14.8 percent
Bear Valley
Testing Positivity 16.0 percent
Harvey Park South
Testing Positivity 16.5 percent
Marston
Testing Positivity 17.7 percent
West Colfax
Testing Positivity 17.7 percent
Auraria
Testing Positivity 18.5 percent
Cole
Testing Positivity 19.3 percent
Gateway-Green Valley Ranch
Testing Positivity 19.4 percent
Harvey Park
Testing Positivity 19.4 percent
Elyria Swansea
Testing Positivity 19.6 percent
Sun Valley
Testing Positivity 19.6 percent
Kennedy
Testing Positivity 19.8 percent
Mar Lee
Testing Positivity 20.0 percent
Globeville
Testing Positivity 21.1 percent
Villa Park
Testing Positivity 21.1 percent
Ruby Hill
Testing Positivity 22.2 percent
Barnum
Testing Positivity 22.7 percent
Athmar Park
Testing Positivity 22.8 percent
College View-South Platte
Testing Positivity 23.6 percent
Barnum West
Testing Positivity 24.3 percent
Montbello
Testing Positivity 25.3 percent
Westwood
Testing Positivity 26.6 percent
Valverde
Testing Positivity 28.7 percent