
File photo

Audio By Carbonatix
Metro Denver rent increases have returned with a vengeance according to recently released figures, and this latest trend echoes one that longtime residents and transplants alike will recognize. A new analysis of rent growth in the United States reveals that prices in Denver went up 48.3 percent from 2010 through the end of last year. The increase is the fourth-highest in the United States during that period, behind only three cities in California’s Bay Area.
The study is by RealPage.com, a property-management software firm that’s been tracking the Denver market for years. And as documented by the site, the current situation is being driven by what might be characterized as a perfect storm for rising rent.
During the first quarter of 2015, for example, Denver registered a 10.5 percent year-over-year rent hike, the most for the Mile High City in two decades.
Here were the four main drivers of this phenomenon according to the site:
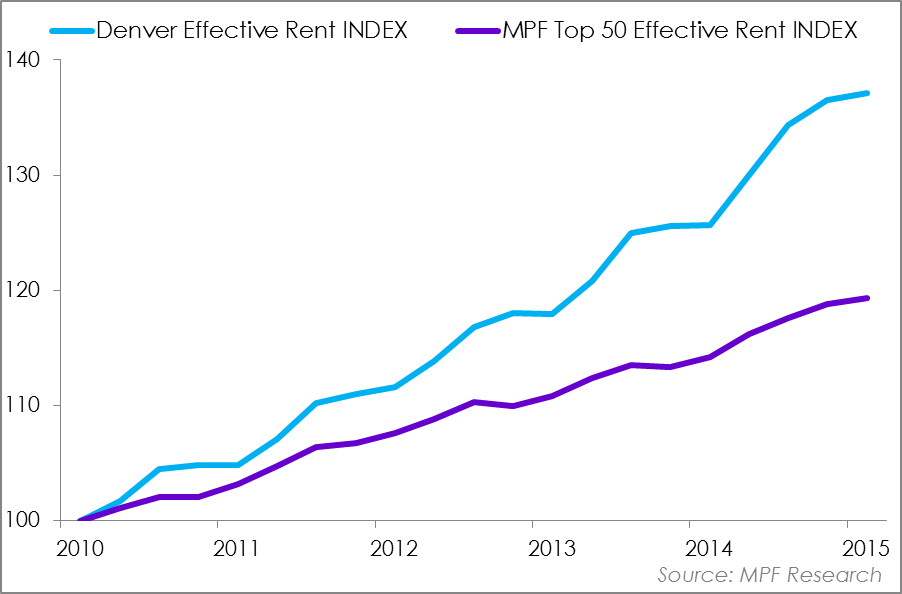
This graph shows Denver’s rent increase from 2010-2015 in comparison to that of the average for the top fifty U.S. markets.
1. Millennials
At the time, metro Denver ranked among the fastest growing metros in the U.S., with an annual population growth estimated at 1.7 percent per annum over the previous ten years – and those between ages twenty and 34 led the invasion. This demographic grew nearly 11 percent between 2011 and early 2015, the second most rapid rate nationally, behind only Austin.
2. Jobs for a College-Educated Workforce
As of 2015, Denver ranked seventh in the country for the percentage of adults 25 and older with at least a bachelor’s degree, and the U.S. census ranked the metro area second overall when it came to luring college-age workers from 2007 to 2012.
3. Income Growth
The high-paying gigs that proved so alluring to young brainiacs caused Denver to be ranked third in the country for median household income growth from 2012-2015. Many of the businesses hiring such workers were tech startups – the Downtown Denver Partnership listed 370 of them in the central business district – but old technology was represented too, with the city ranking fourth for employment in the oil and gas industry. Add in tourism fueled by the popularity of Denver International Airport, which helped 53.4 million passengers get from place to place in 2014, and the result was rising wages for plenty of folks.
4. Real Estate Demand
The housing market was red-hot, with sellers regularly receiving more than 100 percent of list for single-family homes according to the Denver Metro Association of Realtors. Given this level of demand, costs went up and up and up, pushing many of those out of the home-buying mode and into rentals, thereby fueling similar price boosts in that market as well.
Better news seemed on the horizon last summer, when RealPage.com listed Denver as one of the fifteen most active construction markets in the country. The roster was as follows:
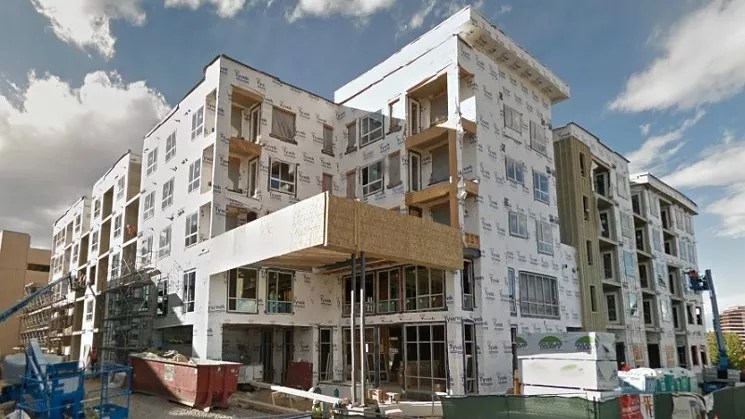
An apartment complex under construction in Denver.
Google Maps
1. Seattle
Annual rent change: 7.2 percent
Occupancy: 97.0 percent
2. Raleigh/Durham
Annual rent change: 4.6 percent
Occupancy 91.4 percent
3. Chicago
Annual rent change: 3.4 percent
Occupancy: 95.2 percent
4. Austin
Annual rent change: 3.2 percent
Occupancy: 95.4 percent
5. New York
Annual rent change: 2.1 percent
Occupancy: 97.4 percent
6. Phoenix
Annual rent change: 1.6 percent
Occupancy: 93.1 percent
7. Boston
Annual rent change: 1.5 percent
Occupancy: 95.4 percent
8. Dallas
Annual rent change: 0.4 percent
Occupancy: 93.8 percent
9. Atlanta
Annual rent change: 0.4 percent
Occupancy: 93.0 percent
10. San Antonio
Annual rent change: 0.1 percent
Occupancy: 93.2 percent
11. Washington, D.C.
Annual rent change: 0.0 percent
Occupancy: 96.5 percent
12. Charlotte
Annual rent change: -0.1 percent
Occupancy: 92.9 percent
13. Los Angeles
Annual rent change: -0.4 percent
Occupancy: 95.9 percent
14. Denver/Boulder
Annual rent change: -1.2 percent
Occupancy: 91.3 percent
15. Houston
Annual rent change: -5.0 percent
Occupancy: 88.4 percent
As you can see, Denver/Boulder rents actually went down as a result of greater apartment availability, and the 91.3 occupancy figure suggested that there was room for further declines. But that’s not the way things worked out. According to Zumper, Denver rent increases in 2017 were far worse than most observers expected, with the median charge for a one-bedroom apartment going up 15.6 percent on a year-to-year basis – the third-most by percentage of 100 cities analyzed.
The RealPage.com data offers more confirmation of the situation. And while a report from California’s CoreLogic suggests that home prices in Denver may finally be about to fall – a scenario that could have a ripple effect on rent – it hasn’t happened yet.
Continue to see the ten rent-growth leaders from 2010-2017:
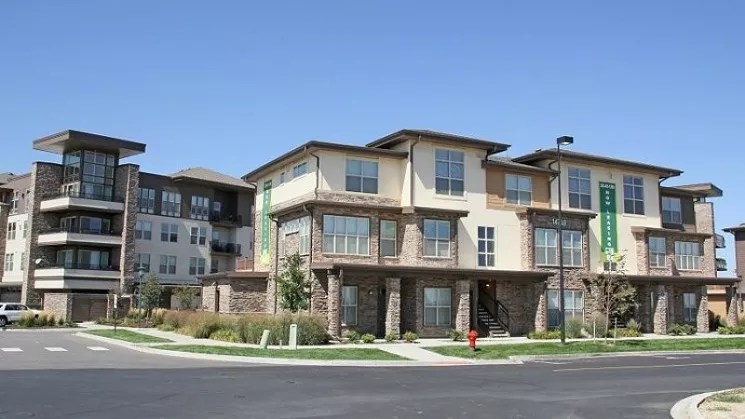
File photo
1. San Jose
Rent change since 2010: 52.4 percent
Effective rents 4Q 2017: $2,680
2. Oakland
Rent change since 2010: 51.1 percent
Effective rents 4Q 2017: $2,259
3. San Francisco
Rent change since 2010: 48.6 percent
Effective rents 4Q 2017: $3,288
4. Denver
Rent change since 2010: 48.3 percent
Effective rents 4Q 2017: $1,401
5. Portland
Rent change since 2010: 45.5 percent
Effective rents 4Q 2017: $1,327
6. Seattle
Rent change since 2010: 43.6 percent
Effective rents 4Q 2017: $1,725
7. Sacramento
Rent change since 2010: 41.0 percent
Effective rents 4Q 2017: $1,359
8. Nashville
Rent change since 2010: 37.4 percent
Effective rents 4Q 2017: $1,116
9. Fort Worth
Rent change since 2010: 35.8 percent
Effective rents 4Q 2017: $995
10. Atlanta
Rent change since 2010: 34.7 percent
Effective rents 4Q 2017: $1,144