


Audio By Carbonatix
Frontier Airlines, which portrays itself as Denver’s hometown airline, finished dead last among the twelve carriers analyzed in the 2017 Airline Quality Rating, just as it did in 2014. According to the report’s co-author, Frontier sunk to the bottom of the rankings again after finishing in eighth and eleventh place during 2015 and 2016, respectively, largely because of customer anger over a series of delays and cancellations last December at Denver International Airport and other facilities around the country. But he also feels the airline may be suffering from something of an identity crisis.
“From the outside, it looks like they’re confused,” notes Dr. Dean Headley, associate marketing professor at the W. Frank Barton School of Business at Wichita State University. “Their performance used to be stellar, and now they’re dropping down.”
That’s true – but Frontier spokesman Jim Faulkner expects that to change. “We’ve been working hard to improve our numbers,” he says. “And we’re moving in the right direction.”
Not all of Frontier’s measurables are terrible; below, we’ve included summaries of the airlines’ performance from the AQR report, which is also shared here. But Headley points out that for Frontier, “December was the bad month.”
No kidding. After a storm hit on December 17, as we reported, some Frontier passengers spent an estimated five hours on the tarmac at DIA, and throngs of others were stuck waiting for flights – and expressing their anger on Twitter.
One of those who chronicled the situation was Martha Obermiller. At 7:58 p.m. on Saturday, December 17, she tweeted: “People are collecting signatures in the customer service of @FlyFrontier because service is actually that bad #frontiersucks.”
She quickly followed up by observing, “Worst customer experience I’ve ever seen #FrontierSucks @frontiercare @FlyFrontier.” Minutes later, she added, “Been in line for 3 hours at customer service for no answers… @FlyFrontier @FrontierCare #FrontierSucks.”
These problems, which took many days to resolve, “aren’t normal,” Faulkner stresses. “That was definitely a one-time event, but we did learn from it – and we’ve made a lot of changes since the first of the year to assure something like that doesn’t happen again.”

Customers waiting for Frontier flights during the DIA delay in December.
Many of the improvements are specific to DIA. Faulkner points to an enlarged, technologically enhanced baggage area to deal with luggage from both connecting flights and those originating and ending in Denver, some strategic carousel shifts and new policies about getting misplaced bags to their owners. For example, if a missing bag is found and needs to be sent to Bozeman, Montana, where Frontier only flies every few days, the airline will now ship it by Federal Express to make sure it arrives as quickly as possible.
Broader changes are important, since the December disaster wasn’t the only issue for Frontier during 2016. “They just weren’t as sharp as they have been,” Headley allows. In contrast, “seven of the twelve airlines in the pool we looked at got better in all four areas of measurement” – described on the report’s website as “on-time arrivals, involuntary denied boardings, mishandled baggage and a combination of twelve customer complaint categories.” If most of the other airlines “are getting better and you don’t change enough, you languish,” Headley maintains. “It’s not going to pull you up the list.”
As for how Frontier can reverse its slide, Headley points to Spirit, which he says “was horrible. They were so bad we almost had to make our scale bigger. But they got a new CEO, who said, ‘We’re going to fix this.’ They didn’t gain a lot of spots in the ranking, but their numbers improved considerably. If you look at the first of the year in terms of complaints and then at the end of the year, you can see that they fell to half of what they were.”
Something similar may be happening at Frontier. Faulkner says internal complaint numbers tumbled 50 percent between January and March.
Be that as it may, Headley isn’t sure the carrier quite knows where it’s going. “They’ve been trying to fiddle with their offer, how they put things forward and how they view themselves as an airline,” he says.
Faulkner, in contrast, feels that Frontier’s vision is clear, “and it’s expressed in our tag line: ‘Low fares done right.’ We want to offer low fares that can allow the opportunity to fly for people who might not otherwise be able to afford it, but to do it right – to make sure you have a good, safe flight and arrive on time with your bags. Pretty much the basic essentials.”
Continue reading to count down the twelve airlines analyzed in the 2017 Airport Quality Rating, complete with photos and summaries from the report.

Alaska Airlines.
File photo
Number 1: Alaska Airlines (AS) had performance improvement in two of the four areas tracked. Better on-time arrival performance (87.3% in 2016 compared to 86.4% in 2015) and a 50% reduction in the rate of mishandled baggage were the bright spots. An increase in involuntary denied boardings per 10,000 passengers (0.40 in 2016 compared to 0.33 in 2015) was the only negative. An identical rate of customer complaints (0.50 per 100,000 passengers in 2016 and 0.50 in 2015) had a neutral effect on the AQR score. Alaska Airlines’ overall AQR score is the third most improved of all airlines rated. With two of four areas showing improvement in performance, the AQR score of -0.80 for Alaska Airlines for 2015 improved to -0.39 for 2016.

Delta Air Lines.
File photo
Number 2: Delta Air Lines (DL) On-time percentage for 2016 shows an improvement over 2015 (86.5% in 2016 and 85.9% in 2015). Their rate of mishandled baggage of 2.08 bags per 1,000 passengers in 2015 was improved to 1.81 for 2016. A decrease in the rate of denied boardings (2016 rate of 0.10 per 10,000 passengers compared to 0.16 for 2015) also helped improve their AQR score for 2016. A decrease in the rate of customer complaints (0.68 per 100,000 passengers in 2016 compared to 0.74 in 2015) combined with other improved performance measures to yield an overall improved AQR score for 2016 (AQR score of – 0.49 in 2015 improved to -0.40 in 2016).
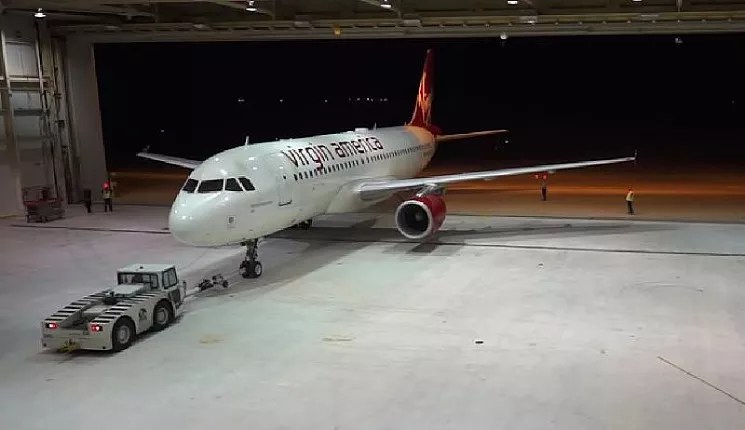
Virgin America Airlines.
File photo
Number 3: Virgin America (VX) On-time performance of 76.2% in 2016 was a decline from their 79.9% for 2015. Virgin America’s involuntary denied boarding performance (0.12 per 10,000 passengers in 2016 was the same as their 0.12 rate in 2015) was the third best of the airlines rated and compares very favorably to the industry average of 0.62. A 2016 customer complaint rate of 1.85 complaints per 100,000 passengers is worse than the industry average of 1.52, and is worse than their 2015 rate of 1.66. Their mishandled baggage rate of 1.03 per 1,000 passengers in 2016 (best of all airlines rated) is better than the industry rate of 2.70 bags per 1,000 passengers but is a decline over their 2015 rate of 0.84. Overall, Virgin America declined in three of the four criteria. They were not able to maintain their industry leading AQR score (-0.40 for 2015) and had a decline in AQR score for 2016 to -0.50.

JetBlue Airways.
File photo
Number 4: JetBlue Airways (B6) On-time performance in 2016 declined to 75.0% from 76.0% in 2015. JetBlue’s denied boarding performance (0.92 per 10,000 passengers in 2016 up from 0.02 in 2015) is a noticeable reversal from previous years. A customer complaint rate of 0.75 complaints per 100,000 passengers was lower in 2016 (0.86 in 2015) and was about half the industry rate of 1.52 for 2016. Their mishandled baggage rate of 1.61 per 1,000 passengers in 2016 was second best among airlines rated and was lower than their 2015 rate of 1.81. JetBlue had the fourth best AQR score (-0.60) of the airlines rated for 2016. The decline in AQR score for 2016 from their 2015 score of -0.44 was the largest decline of all airlines.
Continue to learn more about airlines five through twelve according to AQR 2017, including Frontier, and see the complete report.

Hawaiian Airlines.
File photo
Number 5: Hawaiian Airlines (HA) On-time performance (88.4% in 2015 and 91.1% for 2016) is the best of all airlines rated for 2015 and 2016. Hawaiian’s involuntary denied boarding performance (0.05 per 10,000 passengers in 2016 and 0.03 in 2015) is the best of the airlines rated and compares very favorably to the industry average of 0.62. A customer complaint rate of 1.16 complaints per 100,000 passengers in 2016 is worse than last year’s rate of 1.06. Their mishandled baggage rate of 2.67 per 1,000 passengers in 2016 is slightly worse than their 2015 rate of 2.65. Hawaiian had the fifth best AQR score for 2016 at -0.69 and is one of three airlines to show a decline in their 2016 AQR score.
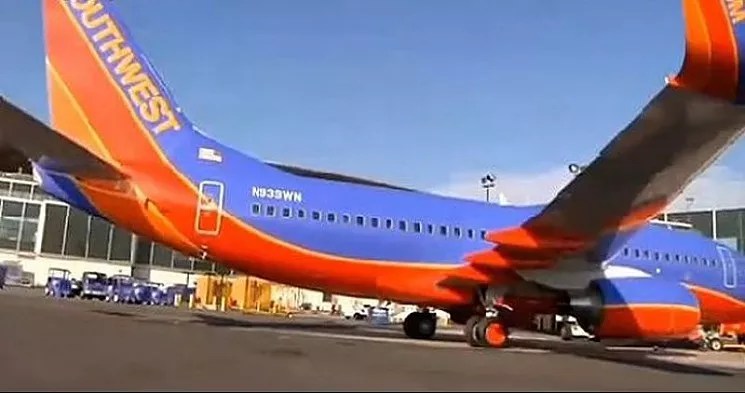
Southwest Airlines.
File photo
Number 6: Southwest Airlines (WN) An on-time arrival percentage of 80.8% in 2016 was better than their 79.7% in 2015. A customer complaint rate of 0.47 per 100,000 passengers in 2016 was better than their 2015 rate of 0.52. An involuntary denied boarding rate of 1.08 per 10,000 passengers in 2015, decreased to 0.99 per 10,000 passengers in 2016. A mishandled baggage rate of 2.98 per 1,000 passengers in 2016 was better than their rate of 3.31 per 1,000 passengers for 2015. Overall, Southwest shows improved performance (AQR score of -0.88 for 2016 compared to -1.00 in 2015) for 2016 with performance improvement in all four areas rated.

SkyWest Airlines.
File photo
Number 7: SkyWest Airlines (OO) On-time performance of 79.7% in 2015, improved to 82.3% for 2016. SkyWest’s involuntary denied boardings performance (0.98 per 10,000 passengers in 2016, compared to 1.78 in 2015) improved, but was above the industry average of 0.62 for 2016. A customer complaint rate of 0.49 complaints per 100,000 passengers in 2016 compared to the 2015 rate of 0.65 had positive impact on their 2016 AQR score. Their mishandled baggage rate of 3.36 per 1,000 passengers in 2016 improved from the 2015 rate of 4.05 bags per 1,000 passengers. SkyWest’s AQR score improved to -0.97 in 2016 from -1.39 in 2015 and is the second most improved airline in the ratings.
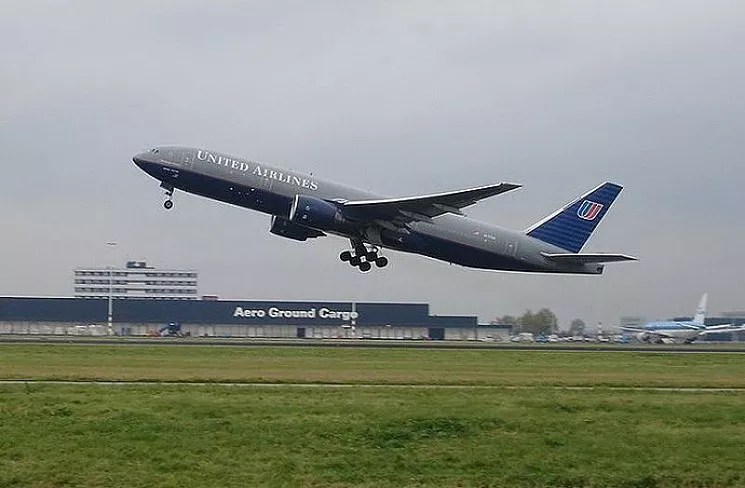
United Airlines.
File photo
Number 8: United Airlines (UA) On-time arrival performance improved from 78.2% in 2015 to 81.7% in 2016. Their mishandled baggage rate decreased from 3.21 per 1,000 passengers in 2015 to 2.60 in 2016. Performance regarding involuntary denied boardings of 0.77 per 10,000 passengers in 2015 improved to 0.43 for 2016. A positive performance in customer complaint rate of 2.27 in 2016 compared to 2.85 per 100,000 passengers in 2015 combined with the other three positive performance improvements helped improve United’s 2016 AQR score to -1.05 from -1.43 in 2015.

American Airlines.
File photo
Number 9: American Airlines (AA) The AQR score for the airline improved in 2016 compared to 2015. The improvement in AQR score reflects better performance in three of four criteria measured. On-time arrivals declined slightly (79.4% in 2016 compared to 8.03% in 2015). Involuntary denied boardings (0.64 in 2016 compared to 0.77 in 2015), baggage handling (3.38 per 1,000 passengers in 2016 compared to 3.98 in 2015) and customer complaints per 100,000 passengers (2.49 in 2016 compared to 3.36 in 2015) all showed improved performance. The impact of better performance outcomes for most criteria combined to produce an improved (-1.35 in 2016 compared to -1.73 in 2015) American Airlines’ AQR score for 2016.

ExpressJet Airlines.
File photo
Number 10: ExpressJet (EV) On-time performance improved in 2016 (79.8% in 2016 compared to 77.9% in 2015). ExpressJet’s involuntary denied boarding performance in 2015 of 1.86 denied boardings per 10,000 passengers was improved to 1.51 in 2016. Even with improvement, their involuntary denied boadings rate is well above the 2016 industry average of 0.62. A customer complaint rate of 0.51 complaints per 100,000 passengers is well below the industry average of 1.52 for 2016 and is better than their 2015 rate of 0.62. Their mishandled baggage rate of 4.31 per 1,000 passengers is higher than the industry rate of 2.70 bags per 1,000 passengers, but is an improvement over their 2015 rate of 5.06. Overall, ExpressJet’s AQR score improved for 2016 compared to 2015 (-1.36 for 2016 compared to -1.66 for 2015).

Spirit Airlines.
File photo
Number 11: Spirit Airlines (NK) was included in the AQR for the first time as an airline required to report performance data in 2015. On-time performance of 69.0% in 2015 was improved to 74.3% in 2016. Spirit’s rate of involuntary denied boarding performance of 0.31 per 10,000 passengers in 2015 declined to 0.58 for 2016. Their mishandled baggage rate of 2.16 per 1,000 passengers in 2016 improved from 2.57 in 2015. A customer complaint rate of 11.73 complaints per 100,000 passengers in 2015 was reduced to 6.74 in 2016. This rate does not compare well to the industry average of 1.52 for all airlines rated. Overall, Spirit Airlines entered the AQR ratings 2015 with the worst AQR score (-3.18) of any airline rated that year. Their AQR score of -2.01 is the most improved of all airlines rated in 2016.

Frontier Airlines.
File photo
Number 12: Frontier Airlines (F9) On-time performance in 2016 (76.0%) improved compared to 2015 (73.2%). Frontier’s denied boarding performance (0.58 per 10,000 passengers in 2016 compared to 1.00 in 2015) was better than last year. Their mishandled baggage rate of 3.83 per 1,000 passengers for 2016 was worse than their 2015 rate of 3.08. A customer complaint rate of 5.94 complaints per 100,000 passengers for 2016 was noticeable lower than their 2015 rate of 7.86. Frontier’s 2016 AQR score of -2.24 compared to -2.60 for 2015 was the result of performance gains in three of the four criteria.