
Photo by Evan Sem

Audio By Carbonatix
Independent Journalism in Denver Needs You
We need to raise $25,000 by August 9 to support the reporting our community depends on. Reader support keeps us independent and is playing a larger role in funding local journalism and shaping what comes next. If you believe independent local journalism matters, make a contribution today.
On May 1, Westword tallied the number of COVID-19 cases in Denver neighborhoods. Four weeks later, we’ve done another count, and the results reveal in stunning detail the spread of the novel coronavirus across the Mile High.
No corner of the city is untouched at this point, and only one neighborhood, Auraria, has not reported additional COVID-19 cases over the past month. In many areas, the totals have more than doubled, including Ruby Hill, which went from 39 cases on April 30 to 93 on May 28, when we accessed the latest figures from the Denver Department of Public Health and Environment’s COVID-19 summary page.
But that’s a minor bump compared to the one in the Civic Center area, where the case count went from 40 on April 30 to 146 on May 28.
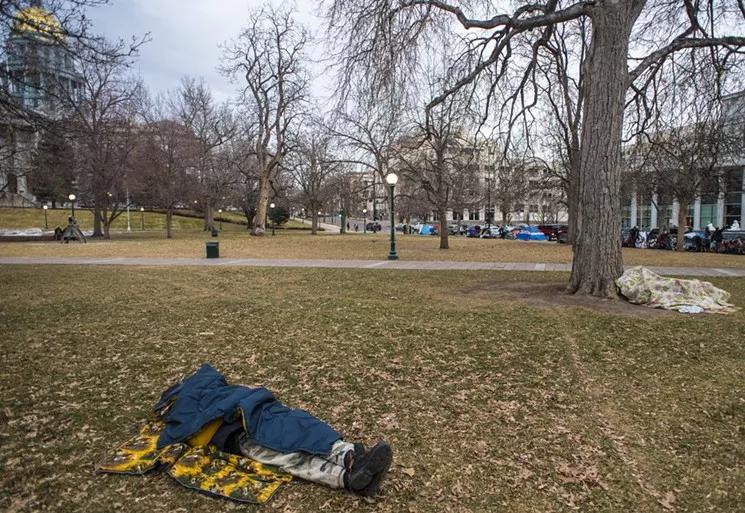
The increase at Civic Center, where a large portion of the local homeless population congregates, is likely attributable at least in part to a boost in testing capability. The number of senior centers in particular neighborhoods, where testing is also way up, is undoubtedly a factor in other spots. But figures like those pertaining to Gateway/Green Valley Ranch, which now has 397 positive cases, up from 197 on April 30, speak for themselves.
For our previous post, we omitted those neighborhoods with a case rate below two per 1,000 residents. This time around, we’ve included 35 more, only eight of which still have a rate under 2.0: Regis, Belcaro, Washington Park West, Overland, Platt Park, University, University Park, Hampden South and Wellshire.
And ten neighborhoods – Athmar Park, Mar Lee, Goldsmith, Rosedale, Bear Valley, Harvey Park South, College View/South Platte, Fort Logan, Marston and Kennedy – have case rates so much higher than 2.0 that they practically form a category of their own.
On April 30, the top case rate for a Denver neighborhood was 16.9 cases per 1,000 people, at Civic Center. Northeast Park Hill came in second, at 6.6 per 1,000. In our update, the Civic Center rate has ballooned to 61.6 per 1,000, and nineteen other neighborhoods have rates that exceed 6.6 per 1,000.
These figures should be kept in perspective: Case counts in Denver and statewide have moderated from their peaks, and public-health officials have tracked a downward trend. But they also serve as a reminder that COVID-19 is far from yesterday’s news.
Here’s the latest list of COVID-19 data from Denver neighborhoods, which are ranked from lowest to highest case rate. The actual number of cases and comparisons to statistics from April 30 are also included for each location.
Platt Park
Case Count 9
Case Rate 1.5 (below 2.0 on April 30)
University
Case Count 15
Case Rate 1.5 (below 2.0 on April 30)
Wellshire
Case Count 5
Case Rate 1.5 (below 2.0 on April 30)
University Park
Case Count 14
Case Rate 1.5 (below 2.0 on April 30)
Regis
Case Count 7
Case Rate 1.6 (below 2.0 on April 30)
Belcaro
Case Count 8
Case Rate 1.6 (below 2.0 on April 30)
Washington Park West
Case Count 13
Case Rate 1.8 (below 2.0 on April 30)
Overland
Case Count 5
Case Rate 1.8 (below 2.0 on April 30)
Hampden South
Case Count 33
Case Rate 1.9 (below 2.0 on April 30)
Baker
Case Count 13
Case Rate 2.0 (below 2.0 on April 30)
Cory-Merrill
Case Count 10
Case Rate 2.3 (below 2.0 on April 30)
Country Club
Case Count 8
Case Rate 2.4 (below 2.0 on April 30)
Jefferson Park
Case Count 15
Case Rate 2.4 (below 2.0 on April 30)
Central Business District (CBD)
Case Count 12
Case Rate 2.5 (below 2.0 on April 30)
Union Station
Case Count 27 (19 on April 30)
Case Rate 2.7 (2.0 on April 30)
Congress Park
Case Count 30
Case Rate 2.7 (below 2.0 on April 30)
Cherry Creek
Case Count 22
Case Rate 2.8 (below 2.0 on April 30)
Speer
Case Count 37 (28 on April 30)
Case Rate 2.8 (2.1 on April 30)
Capitol Hill
Case Count 47 (38 on April 30)
Case Rate 2.8 (2.3 on April 30)
City Park
Case Count 10 (8 on April 30)
Case Rate 2.9 (2.3 on April 30)
West Highland
Case Count 31 (22 on April 30)
Case Rate 3.0 (2.2 on April 30)
University Hills
Case Count 19 (15 on April 30)
Case Rate 3.1 (2.4 on April 30)
Sun Valley
Case Count 5
Case Rate 3.2 (below 2.0 on April 30)
Washington Park
Case Count 24 (23 on April 30)
Case Rate 3.2 (3.1 on April 30)
Chaffee Park
Case Count 14
Case Rate 3.3 (below 2.0 on April 30)
Stapleton
Case Count 90
Case Rate 3.3 (below 2.0 on April 30)
Sloan Lake
Case Count 28
Case Rate 3.4 (below 2.0 on April 30)
South Park Hill
Case Count 33 (30 on April 30)
Case Rate 3.4 (3.1 on April 30)
Hale
Case Count 30 (24 on April 30)
Case Rate 3.6 (2.8 on April 30)
Marston
Case Count 26
Case Rate 3.6 (not included on April 30)
Berkeley
Case Count 37 (30 on April 30)
Case Rate 4.0 (3.2 on April 30)
Auraria
Case Count < 5 (same as on April 30)
Case Rate 4.1 (5.5 on April 30)
Rosedale
Case Count 12
Case Rate 4.2 (not included on April 30)
DIA
Case Count 7 (5 on April 30)
Case Rate 4.3 (3.1 on April 30)
Kennedy
Case Count 22
Case Rate 4.3 (not included on April 30)
North Capitol Hill
Case Count 35 (21 on April 30)
Case Rate 4.4 (2.7 on April 30)
Goldsmith
Case Count 29 (not included on April 30)
Case Rate 4.4
Fort Logan
Case Count 41
Case Rate 4.4 (not included on April 30)
North Park Hill
Case Count 46 (33 on April 30)
Case Rate 4.5 (3.2 on April 30)
Bear Valley
Case Count 45
Case Rate 4.6 (not included on April 30)
Lincoln Park
Case Count 33 (15 on April 30)
Case Rate 4.6 (2.1 on April 30)
West Colfax
Case Count 64 (41 on April 30)
Case Rate 4.6 (2.9 on April 30)
Sunnyside
Case Count 52
Case Rate 4.7 (not included on April 30)
Indian Creek
Case Count 16 (12 on April 30)
Case Rate 4.8 (3.6 on April 30)
Clayton
Case Count 24
Case Rate 4.8 (below 2.0 on April 30)
Cheesman Park
Case Count 44
Case Rate 4.9 (not included on April 30)
Whittier
Case Count 27 (16 on April 30)
Case Rate 5.0 (3.0 on April 30)
Cole
Case Count 27 (17 on April 30)
Case Rate 5.1 (3.2 on April 30)
Lowry Field
Case Count 45 (32 on April 30)
Case Rate 5.1 (3.6 on April 30)
Washington Virginia Vale
Case Count 76 (41 on April 30)
Case Rate 5.2 (2.8 on April 30)
Globeville
Case Count 23 (10 on April 30)
Case Rate 5.3 (2.3 on April 30)
Southmoor Park
Case Count 30 (26 on April 30)
Case Rate 5.4 (4.6 on April 30)
Hampden
Case Count 118 (77 on April 30)
Case Rate 5.8 (3.8 on April 30)
Skyland
Case Count 21 (19 on April 30)
Case Rate 5.9 (5.3 on April 30)
Harvey Park
Case Count 76 (33 on April 30)
Case Rate 6.1 (2.6 on April 30)
Villa Park
Case Count 59 (32 on April 30)
Case Rate 6.1 (3.3 on April 30)
Five Points
Case Count 132 (67 on April 30)
Case Rate 6.3 (3.2 on April 30)
Barnum
Case Count 44 (20 on April 30)
Case Rate 6.5 (3.0 on April 30)
City Park West
Case Count 38
Case Rate 6.6 (not included on April 30)
Goldsmith
Case Count 45
Case Rate 6.8 (not included on April 30)
Harvey Park South
Case Count 63
Case Rate 6.9 (not included on April 30)
East Colfax
Case Count 79 (39 on April 30)
Case Rate 7.0 (3.5 on April 30)
Windsor
Case Count 104 (57 on April 30)
Case Rate 7.2 (4.0 on April 30)
Mar Lee
Case Count 98
Case Rate 7.2 (not included on April 30)
College View/South Platte
Case Count 57
Case Rate 7.7 (not included on April 30)
Virginia Village
Case Count 113 (75 on April 30)
Case Rate 7.8 (5.2 on April 30)
Elyria Swansea
Case Count 55
Case Rate 7.9 (not included on April 30)
Ruby Hill
Case Count 93 (39 on April 30)
Case Rate 8.4 (3.5 on April 30)
Hilltop
Case Count 85 (64 on April 30)
Case Rate 8.4 (6.3 on April 30)
Gateway/Green Valley Ranch
Case Count 377 (197 on April 30)
Case Rate 8.9 (4.7 on April 30)
Barnum West
Case Count 56 (22 on April 30)
Case Rate 9.4 (3.7 on April 30)
Northeast Park Hill
Case Count 103 (62 on April 30)
Case Rate 10.9 (6.6 on April 30)
Athmar Park
Case Count 107
Case Rate 10.9 (not included on April 30)
Westwood
Case Count 206 (88 on April 30)
Case Rate 11.4 (4.9 on April 30)
Valverde
Case Count 53 (26 on April 30)
Case Rate 12.3 (6.0 on April 30)
Montbello
Case Count 445 (190 on April 30)
Case Rate 13.1 (5.6 on April 30)
Civic Center
Case Count 146 (40 on April 30)
Case Rate 61.6 (16.9 on April 30)