

Photo by Kenneth Hamblin III

Audio By Carbonatix
Our recent post about Colorado’s population growth this decade used U.S. Census Bureau stats to explore the impact the ongoing population boom has had on our state. But data released on December 19 provides even more details about how the residents of our state live today.
Specifically, the bureau issued a massive update to its American Community Survey covering the five-year period between 2014 and 2018. The facts and figures are broken into a slew of categories and subject areas, most of which will apply to Coloradans of every description.
Continue reading to learn more about your neighbors and how you contribute to the state’s vast tapestry.
Households and Families
The estimated number of households in Colorado is 2.1 million, with the average size of each put at 2.56 people.
Families constitute 64.0 percent of total households. Of this amount, 49.7 percent are classified as married or couple families, while 14.3 percent fall into the “other families” category. But 27.4 percent of Coloradans live alone and 8.6 percent represent “other non-family households” that would include roommate scenarios.
A little less than a third of these households (31.2 percent) include one or more people under age eighteen, and nearly a quarter (24.8 percent) boast at least one person who’s age 65 or older. In Colorado, 100,450 grandparents live with grandchildren under eighteen, and 34.7 percent of them are primary caretakers.
Marital status
In a nod to an earlier era (we think), the bureau counts only married folks who are fifteen and above. Of males in Colorado who fit that description, 50.8 percent of them are married. For females, the sum is 50.1 percent.
Of the remainder, 35.4 percent of males and 28.2 percent of females have never married. Meanwhile, Colorado women are more likely to be separated (1.7 percent compared to 1.2 percent), widowed (6.6 percent to 2.1 percent) or divorced (13.4 percent to 10.4 percent) than are their male counterparts.
Nativity and foreign born
Between 2014 and 2018, 90.2 percent of people living in Colorado are U.S. natives, and 42.5 percent were in the state at birth and still reside here.
That leaves 9.8 percent who were born in a foreign country. Of that total, 41.3 percent are naturalized U.S. citizens and 82 percent came to this country before 2010.
The largest percentage of those born outside our borders, 51.9 percent, originally hail from Latin America, while 24.6 percent began life in Asia, 13.4 percent in Europe, 6.6 percent in Africa, 2.6 percent in “Northern America” (Canada, most likely) and 0.9 percent in Oceania, which encompasses Australasia, Melanesia, Micronesia and Polynesia.
Language
The vast majority of people in Colorado age five or older converse using English in their home. The 17 percent who don’t are dominated by Spanish speakers (11.8 percent), with 2.3 percent relying on “other Indo-European languages,” 2.0 percent relying on lingo associated with Asian and Pacific Islander areas, and 0.9 percent utilizing other tongues. Overall, 5.9 percent of respondents conceded that they don’t speak English “very well.”
U.S. Census Bureau
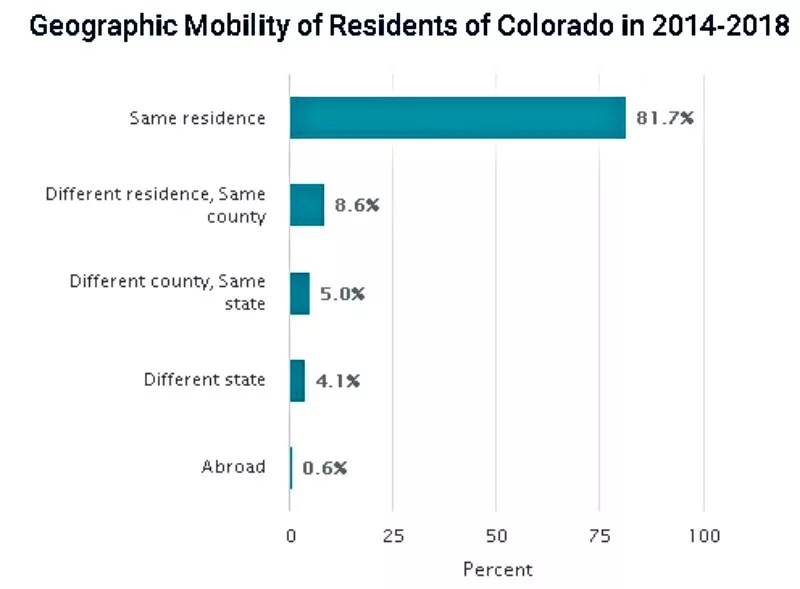
Geographic mobility
As seen in the graphic above, most Coloradans – 81.7 percent – are still living in the same home where they’d resided the previous year. The remainder include 8.6 percent who relocated to a different residence in the same county, 5.0 percent who shifted to a different county within Colorado, 4.1 percent who headed to a different state and 0.6 percent who moved abroad.
Education
The vast majority of people in Colorado graduate from high school; 91.4 percent received a diploma. Moreover, 40.1 percent of Coloradans hold a bachelor’s degree or higher.
The complete breakdown: 8.6 percent didn’t graduate from high school, 21.4 percent did or achieved its equivalent (read: a GED); another 21.4 percent completed some college coursework but fell short of earning a degree; 8.4 percent received an associate’s degree; 25.2 percent collected a bachelor’s degree; and 15.0 percent qualified for a graduate or professional degree.
Plenty of Coloradans are still in school: 1.4 million. Enrollment in nursery school stands at 88,085, kindergarten through twelfth grade at 924,477 and college or graduate school at 384,244.
Disability
One out of ten people in Colorado who aren’t institutionalized (10.6 percent, to be specific) report that they have a disability. This amount is dominated by those 65 and older, 32.2 of whom are disabled, with 3.3 percent of folks under eighteen and 8.7 percent of ones between 18 and 64 experiencing similar challenges.
Employer status and type of employer
Here’s one of the most surprising findings in the survey: The percentage of people age sixteen and over who are employed stands at just 64.4 percent, and 31.7 percent said they aren’t currently in the labor force. This indicates a large population at either extreme of the age range.
Around 80.3 percent of workers (2,279,076 people) are salaried or receive a private wage, 13.3 percent (378,614) work for federal, state or local government, and 6.2 percent (176,336) are self-employed.
This graphic shows how these jobs are divvied up by industry:

U.S.Census Bureau
Occupations
What are the most typical jobs in Colorado? Here’s a general overview:
• Management, business, sciences, and arts occupations: 1,186,757 (41.8 percent)
• Service occupations: 483,668 (17.0 percent)
• Sales and office occupations: 620,318 (21.8 percent)
• Natural resources, construction, and maintenance occupations: 266,469 (9.4 percent)
• Production, transportation, and material moving occupations: 282,162 (9.9 percent)
Commuting to Work
Approximately 75.3 percent of Colorado employees drive to work alone. Just 8.8 percent carpool, 3.1 percent use public transportation, 2.8 percent walk, and 2.2 percent get to their destination by “other means,” such as cycling. Another 7.7 percent work at home.
Income
The median household income in Colorado comes in at $68,811. But 5.1 percent of respondents say their annual household income is below $10,000, in contrast to the 7.9 percent who bring in over $200,000 per annum.
For full-timers, the median earning level is $50,766 – and yes, there is a significant gender gap. Men in this category collect $54,589, as opposed to $45,170 for women.
About 25.2 percent of households report receiving Social Security benefits, and 16.8 percent get supplementary retirement income. The average Social Security haul is a modest $19,225.
Poverty and participation in government programs
A horrifying statistic: 10.9 percent of Coloradans live in poverty. The number is even higher (13.5 percent) for children under eighteen; 7.5 percent of people age 65 or older and 10.7 percent of individuals between eighteen and 64 are in the same sad situation.
The Supplemental Nutrition Assistance Program, or SNAP, is supplied to 8.0 percent of Colorado households. More than half of this number, 51.9 percent, includes children under eighteen, an additional 29.5 percent of SNAP funds go to households with one or more people above age sixty, and 31.0 percent are described as “families with a female householder and no husband present.”
Another distressing digit: 35.8 percent of households getting SNAP have two or more people who are employed but obviously not earning enough to cover their needs and those of other loved ones.
Health insurance
The percentage of Coloradans not living in institutions who have health insurance hits 91.9 percent. The coverage is largely supplied by private carriers (70.5 percent); government coverage contributes 32.0 percent. (Note that some people keep more than one policy.) Unfortunately, 4.7 percent of children under nineteen have no coverage at all.
Housing inventory characteristics
Colorado sports 2.4 million housing units, 69.7 percent of which are single family homes that don’t attach to any other building. Multi-unit structures account for 26.1 percent of the housing units and 4.1 percent are mobile homes. The rest, including boats, recreational vehicles, vans and more, are grouped under the umbrella term “other.”
The occupied housing units are owned by individuals 64.9 percent of the time; renters make up 35.1 percent. The median price for an owner-occupied house was $313,600 statewide, and the median gross rent stand at $1,196. Cost-burdened households, defined as those whose members were paying 30 percent or more of their income for housing alone, include 27.6 percent of homeowners with a mortgage, 11.2 percent of owners without one, and a shocking 51.1 percent of renters.
Clearly, living in today’s Colorado doesn’t come cheap.