

File photo

Audio By Carbonatix
Advertising Can't Do It Alone
The challenges facing local news organizations are very real. That's why reader support matters more than ever. If you believe independent journalism matters, make a contribution today and help us reach our summer fundraising goal of $25,000 by August 9.
Editor’s note: This post is the fifth in our series about Denver traffic. Click to read our previous items, “Denver’s Longest Traffic Signal and Wait Times on Major Routes,” “Denver’s Fight to Prevent Total Traffic Gridlock Downtown,” “Denver’s Ten Most Dangerous Intersections” and “Denver Traffic Deaths on Pace for One of the Highest Totals This Century.”
The number of hit-and-run accidents in Denver every year is at a level far higher than most area drivers realize.
“There were 547 hit-and-runs in May,” says Scott O’Sullivan, principal of the O’Sullivan Law Firm and one of the developers behind the new Denver Accident Map. “That’s crazy!”
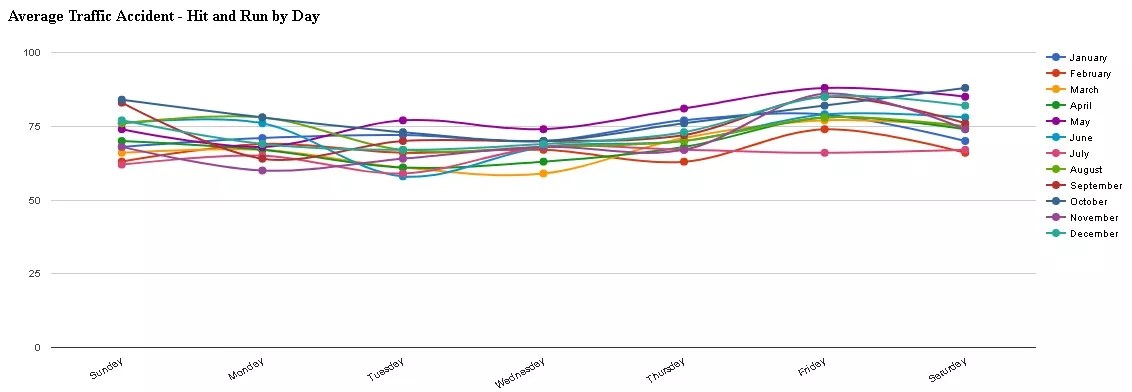
The map, which O’Sullivan co-conceived with Andrew Russette, his brother-in-law and what he affectionately calls a “super data nerd,” compiles Denver Police Department reports and statistics in a user-friendly manner that’s automatically updated every 24 hours. And the level of detail is astonishing. For example, the map, which we drew from for a recent post about the disturbing number of traffic fatalities in 2018 to date, breaks down hit-and-runs by days of the week, revealing that while such incidents happen more frequently on weekends, weekdays aren’t far behind.
O’Sullivan stresses that the majority of hit-and-runs in Denver don’t involve a driver striking a moving vehicle and then hightailing it. “Most of them are the kind of thing where you wake up and see that your car has been hit and you call it in,” he notes. “They’re not usually active-driving hit-and-runs.”
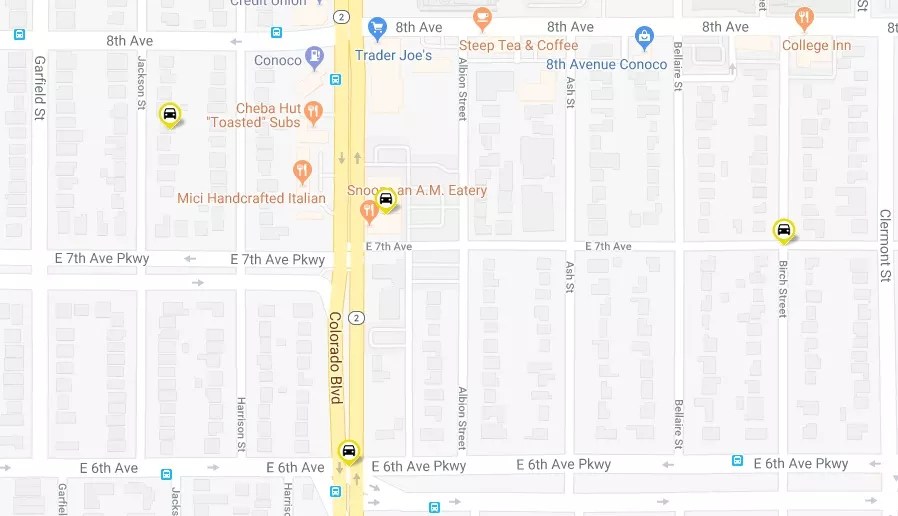
Nonetheless, the map reveals plenty of what O’Sullivan refers to as “hot spots,” including Colorado Boulevard, where hit-and-runs are ultra-common. As evidence, check out the following map excerpt from an area near Snooze and Trader Joe’s. The icons that look like cars over a yellow backdrop designate hit-and-run locations.
The map also shows that, on average, there are more hit-and-runs on Fridays, Saturdays and Sundays than any other days, suggesting that drivers who would have been better off calling a Lyft got behind the wheel anyhow and wound up smashing into something.
Hit-and-runs also tend to happen more often during the last three months of the year, when holiday and company parties are in full swing and the booze flows freely.
“When you look at the map, it looks like hit-and-runs are some kind of epidemic,” O’Sullivan points out.
He’s right. The lowest average number of accidents on a day of the week in Denver is Wednesday, with “just” 795 per annum. The most? Fridays, with an estimated 955.
Continue to see hit-and-runs in Denver per day of the week, including a month-by-month breakdown, based on the average number of reports from 2012 through 2018.
Sunday
January: 68
February: 63
March: 66
April: 70
May: 74
June: 74
July: 62
August: 76
September: 83
October: 84
November: 68
December: 77
Total: 865
Monday
January: 71
February: 69
March: 67
April: 67
May: 68
June: 76
July: 65
August: 78
September: 64
October: 78
November: 60
December: 69
Total: 832
Tuesday
January: 72
February: 66
March: 61
April: 61
May: 77
June: 58
July: 59
August: 67
September: 70
October: 73
November: 64
December: 67
Total: 795

The bicycle being ridden by Mark Mihelic when he was struck and seriously injured by a hit-and-run driver in 2015.
File photo
Wednesday
January: 70
February: 67
March: 59
April: 63
May: 74
June: 68
July: 68
August: 68
September: 70
October: 70
November: 68
December: 69
Total: 814
Thursday
January: 77
February: 63
March: 71
April: 68
May: 81
June: 69
July: 67
August: 70
September: 72
October: 76
November: 67
December: 73
Total: 854
Friday
January: 79
February: 74
March: 77
April: 78
May: 88
June: 77
July: 66
August: 78
September: 85
October: 82
November: 86
December: 85
Total: 955
Saturday
January: 70
February: 66
March: 75
April: 74
May: 85
June: 75
July: 67
August: 75
September: 76
October: 88
November: 74
December: 82
Total: 907