

ljubaphoto/Getty Images

Audio By Carbonatix
Violent crime in Denver went up by nearly 8 percent from 2017 to 2018, and murders rose by more than 10 percent during the same period. And while the total number of sex crimes in the Mile High City over this span fell slightly, the offenses that were cleared by law enforcement took a substantial dip. Last year, Denver rapists were identified and/or arrested in only about four of ten cases.
These statistics and more were part of new information recently shared on Colorado Crime Statistics, an indispensable online database maintained by the Colorado Bureau of Investigation. To date, most coverage of the new digits has focused on the CBI’s first-ever compilation of details related to hate crimes, and that’s understandable, since the 185 incidents documented for the state is nearly double the 96 counted by the Colorado Division of Homeland Security and Emergency Management in 2017.
But the site also allows users to drill down to specific jurisdictions, as we did last year following its launch to explore Denver-specific details about murder, sex crimes, aggravated assaults and robbery. The digits about Denver we unearthed allow us to directly compare facts and figures from 2017 and 2018, as well as how many of the Denver Police Department’s cases were designated as “cleared,” a term CBI communications director Susan Medina defines like so:
“‘Cleared,’ in most cases, means one or more arrests were made,” Medina explains via email. “However, there are exceptions where an incident has reached a conclusion from the law enforcement perspective. An incident is also cleared if the offender is found but not arrested. These are called ‘exceptional clearances.’ Exceptional clearance occurs when the offender is a juvenile released to the parents, or if the offender is found to be deceased or if the offender is found to be in the custody of another jurisdiction. Also, an exceptional clearance may occur if the case cannot proceed by either prosecution declining the case or the victim refusing to cooperate. Then the incident is counted as cleared.”
In all cases, though, “‘cleared’ means law enforcement has found the perpetrator of the crimes which occurred in the reported incident,” she stresses.
When it comes to hate crimes, Denver contributed more than its share. The number of folks living in Denver in 2018, as opposed to the metro area in general, is estimated at 716,492, or about 12.6 percent of the approximately 5,696,000 Colorado residents last year. However, the 35 hate crimes in Denver circa 2018 represents 18.9 percent of the 185 statewide.
Just over half of these crimes were cleared in both Denver and Colorado, with the vast majority here falling under two umbrellas: race/ethnicity/ancestry bias (16) and sexual-orientation bias (11). In the former category, African-Americans were by far the most likely to be victimized in Denver (10) and Colorado (47). But religious bias, which is distressingly prevalent across Colorado, was registered infrequently in Denver, where just two of the 26 hate crimes of this type took place.
Here’s the hate-crime breakdown for Denver, followed by the Colorado stats. The graphic below takes a look at hate-crime victims by offense type, location and victim type.
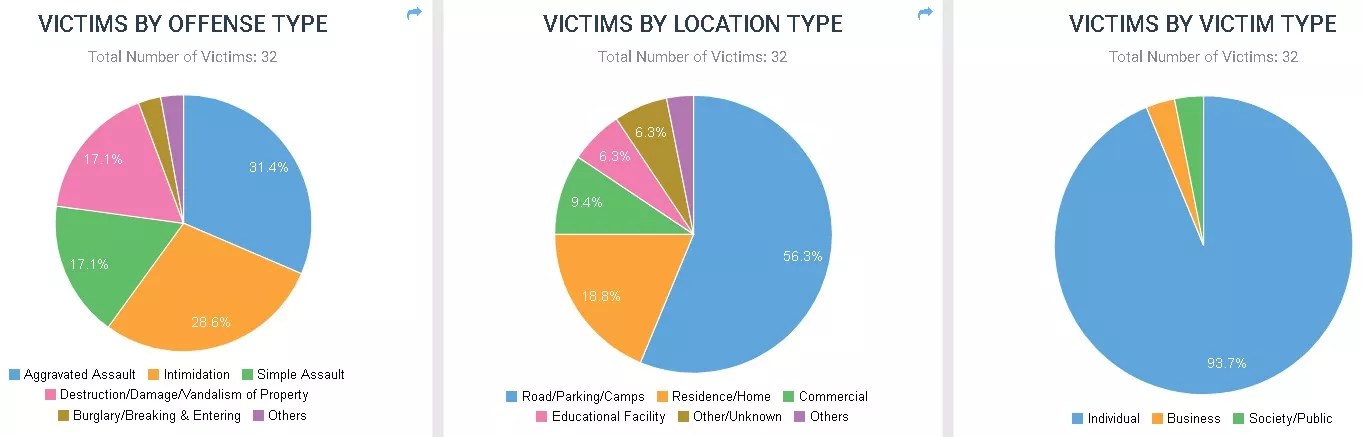
Total Hate Crimes
Number of crimes 2018: 35 (185 in Colorado)
Percentage of crimes cleared 2018: 54 (56 percent in Colorado)
Hate Crime Victims by Bias
Race/Ethnicity/Ancestry Bias 2018: 16 (112 in Colorado)
Religious Bias 2018: 2 (26 in Colorado)
Sexual Orientation Bias 2018: 11 (29 in Colorado)
Disability Bias 2018: 1 (4 in Colorado)
Gender Identity Bias 2018: 3 (3 in Colorado)
Hate Crime Victims by Race/Ethnicity/Ancestry Bias
Anti-white 2018: 2 (8 in Colorado)
Anti-black or African American 2018: 10 (47 in Colorado)
Anti-American Indian or Alaska Native 2018: 0 (1 in Colorado)
Anti-Asian 2018: 0 (1 in Colorado)
Anti-multiple races, group 2018: 0 (12 in Colorado)
Anti-Arab 2018: 0 (2 in Colorado)
Anti-Hispanic or Latino 2018: 2 (27 in Colorado)
Anti-other race/ethnicity/ancestry in 2018: 2 (12 in Colorado)
Hate Crime Victims by Religious Bias
Anti-Jewish 2018: 0 (16 in Colorado)
Anti-Islamic (Muslim) 2018: 2 (7 in Colorado)
Anti-Jehovah’s Witness 2018: 0 (1 in Colorado)
Anti-other religion 2018: 0 (2 in Colorado)
Violent crimes in Denver took a disturbing leap from 2017 to 2018, when 457 more offenses took place. The rise in murders from 58 in 2017 to 65 in 2018 is especially troubling – and so, too, is the increase in aggravated assaults. The 2018 aggravated-assault figure in Denver, 3,314, is 509 more than the previous year’s and actually exceeds the total difference between 2017 and 2018 by itself.
The 55 percent clearance rate for violent crimes circa 2018 is the same as it was the year before, and the percentages were better when it comes to murders, aggravated assaults and robberies. But clearing a robbery case is much like a game of Three-Card Monte: Barely over a third of these crimes were cleared in each of the past two years.
Here are the Denver numbers for 2018, with those from 2017 juxtaposed, along with a graphic that considers victims of violent crime by age, sex and race.
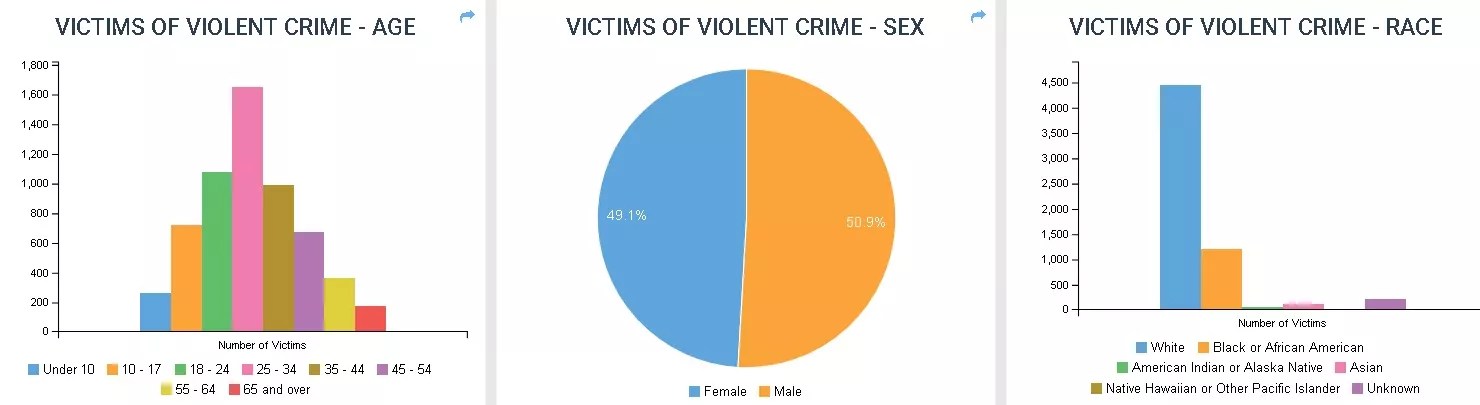
Total Violent Crimes
Number of crimes 2018: 5,802 (5,345 in 2017)
Percentage of crimes cleared 2018: 55 percent (55 percent in 2017)
Total Murders
Number of crimes 2018: 65 (58 in 2017)
Percentage of crimes cleared 2018: 71 (62 percent in 2017)
Total Aggravated Assaults
Number of crimes 2018: 3,314 (2,805 in 2017)
Percentage of crimes cleared 2018: 62 (60 percent in 2017)
Total Robberies
Number of crimes 2018: 1,218 (1,236 in 2017)
Percentage of crimes cleared 2018: 37 (38 percent)
Sex crimes are included in the overall violent-crime statistics, but they deserve to be singled out because of an unfortunate decline in clearances.
As you’ll see, the number of what are referred to as non-consensual sex offenses slid from 1,217 in 2017 to 1,205 in 2018, with similar decreases in the brackets for fondling and sodomy. But rapes were up by more than 9 percent, and sexual assault with an object also rose, going from five to eight.
To make a bad situation worse, the percentage of sex crimes cleared plunged overall and in each separate category. The downturn was especially precipitous for rape, where clearances went from 57.03 percent in 2017 to 42.49 percent in 2018.
Continue to see the specifics for Denver during the past two years, below a graphic that depicts sex offenses by offense type, location and the sort of weapon or force involved.
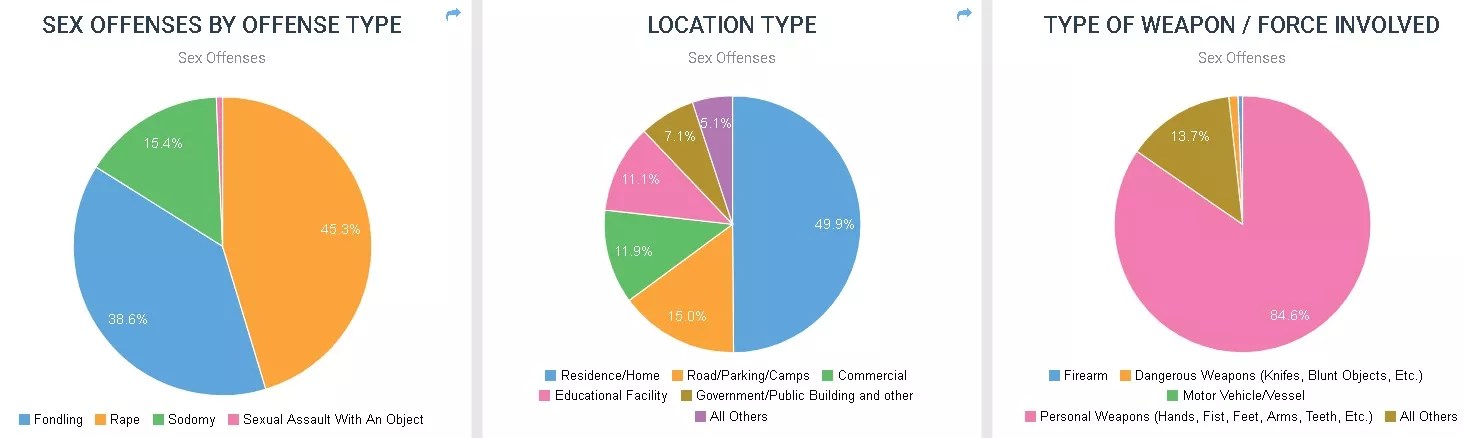
Total non-consenusal Sex Offenses
Number of crimes 2018: 1,205 (1,217 in 2017)
Number of crimes cleared 2018: 618 (694 in 2017)
Percentage of crimes cleared 2018: 51.29 (57.02 in 2017)
Rape
Number of crimes 2018: 546 (518 in 2017)
Number of crimes cleared 2018: 232 (234 in 2017)
Percentage of crimes cleared 2018: 42.49 (57.03 in 2017)
Fondling
Number of crimes 2018: 465 (490 in 2017)
Number of crimes cleared 2018: 286 (333 in 2017)
Percentage of crimes cleared 2018: 61.51 (67.96 in 2017)
Sodomy
Number of crimes 2018: 186 (204 in 2017)
Number of crimes cleared 2018: 97 (125 in 2017)
Percentage of crimes cleared 2018: 52.15 (61.27 in 2017)
Sexual Assault With an Object
Number of crimes 2018: 8 (5 in 2017)
Number of crimes cleared 2018: 3 (2 in 2017)
Percentage of crimes cleared 2018: 37.50 (40.0 in 2017)
Click to visit the 2018 Colorado Crime Statistics Overview page.