One big reason: Over the past nine years or so, median home prices in Denver County have risen 215 percent, but during the same period, average wages have only gone up 17 percent.
"That's the evidence of the imbalance," says Daren Blomquist, senior vice president of ATTOM Data Solutions, which has just released a comprehensive report about home affordability nationwide. "The numbers are almost absurd."
ATTOM's data crunchers calculate home affordability based on a number of factors, including annualized weekly wages and the percentage of annualized wages needed to purchase a home in a given area. They then assign a number to each county, with 100 serving as the base line. In counties that score above 100, homes are more affordable by comparison with historical average since the first quarter of 2005, when ATTOM started tracking the stats, and less affordable in counties that register less than 100.
Denver's score: 72. Only Michigan's Genesee County, the location of Flint, came in lower, at 70. And as Blomquist points out, Flint's economy is among the most troubled in the nation over the past decade-plus. "Home prices there are actually very low," he says, "but they're coming from a much lower place, and the correction has been severe."
As this observation implies, ATTOM uses a home-affordability metric that looks beyond price.

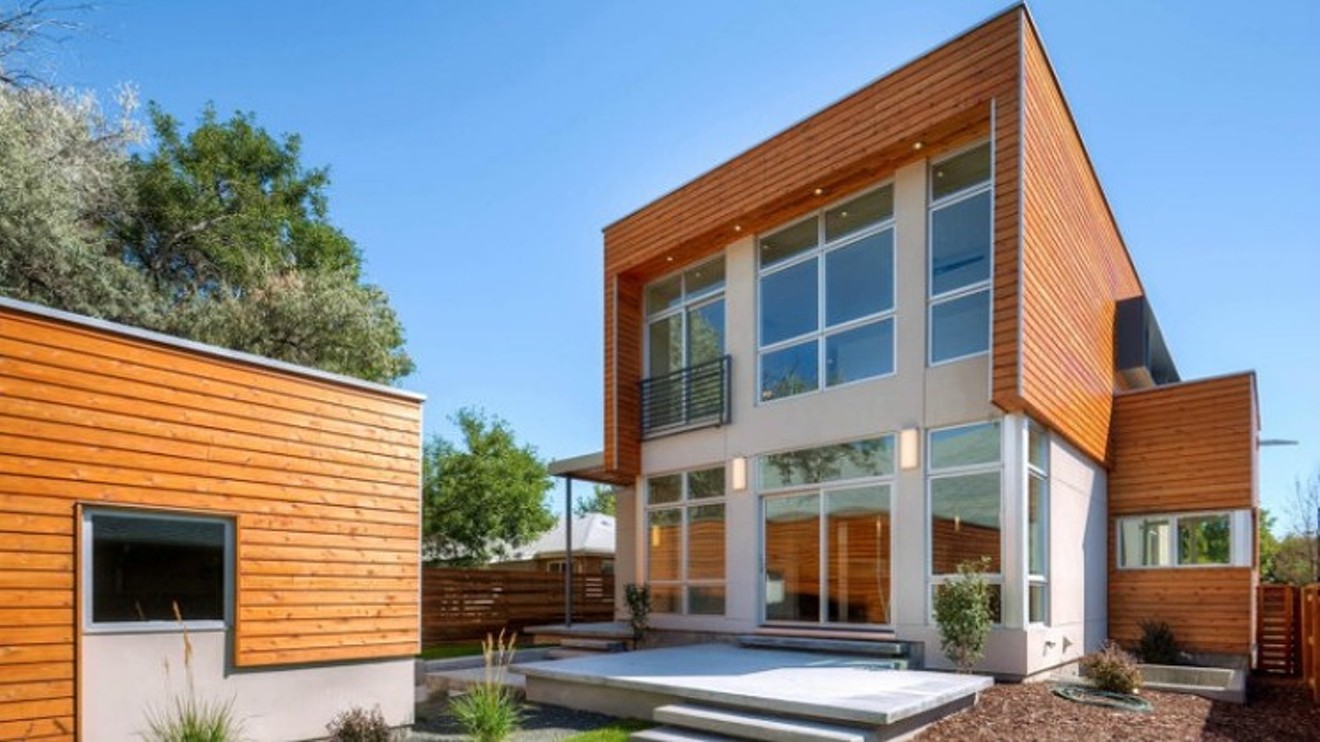
A residence included in the 2016 Denver Modern Home tour.
File photo
Other Colorado counties aren't far behind. Of the 25 least-affordable metro areas in the country, a staggering six are from Colorado. Adams County is third worst on the affordability scale, and Arapahoe, Weld, Jefferson and Boulder turn up as well. The full statistics are below.
Home affordability is an issue nationwide, Blomquist stresses. Indeed, American home prices are at their least affordable since the third quarter of 2008. But the situation is particularly acute in Denver, whose situation is "rooted in an imbalance of supply and demand, where demand is far outweighing supply," Blomquist explains. "There's also a lot of outside migration into the Denver area that's creating additional demand — and a lot of times, that demand is represented by buyers who are willing to pay more than a local buyer might be willing to pay. In that way, migration his transforming the Denver market."
In Blomquist's view, the supply situation in Denver was exacerbated by "the construction-defect law that constricted the market for building condos;" our September 2013 feature "Has Condo Development Hit a Wall in Denver?" provides a trove of additional details. And the screws have been tightened further by rising mortgage rates. "That's accelerated the deteriorating everywhere," he points out. "It's not just prices outpacing wages. On top of that, it costs more to borrow money now than it did a year ago" — and in Denver, that's made a bad situation worse.
Continue to see details about the six Colorado counties among the 25 least affordable in the country, ranked in descending order.

A residence included in the 2016 Denver Modern Home tour.
File photo
Metropolitan Statistical Area: Boulder, CO
State: Colorado
Annualized Weekly Wages: $64,831
Percentage of Annualized Wages to Buy: 60.6 percent
Second Quarter 2018 Affordability Index* (Under 100 is Less Affordable Than Historic Average): 80
Second Quarter 2018 Median Sales Price: $525,000
Year-Over-Year Annualized Wage Growth: 4.6 percent
Year-Over-Year Median Home Price Growth: 5.7 percent
National ranking: 24th worst home affordability
County: Jefferson
Metropolitan Statistical Area: Denver-Aurora-Lakewood
State: Colorado
Annualized Weekly Wages: $56,446
Percentage of Annualized Wages to Buy: 54.1 percent
Second Quarter 2018 Affordability Index* (Under 100 is Less Affordable Than Historic Average): 79
Second Quarter 2018 Median Sales Price: $410,000
Year-Over-Year Annualized Wage Growth: 4.7 percent
Year-Over-Year Median Home Price Growth: 7.9 percent
National ranking: 20th worst home affordability
County: Weld
Metropolitan Statistical Area: Greeley, CO
State: Colorado
Annualized Weekly Wages: $48,945
Percentage of Annualized Wages to Buy: 48.5 percent
Second Quarter 2018 Affordability Index* (Under 100 is Less Affordable Than Historic Average): 77
Second Quarter 2018 Median Sales Price: $325,000
Year-Over-Year Annualized Wage Growth: 5.9 percent
Year-Over-Year Median Home Price Growth: 9.6 percent
National ranking: 12th worst home affordability

A residence included in the 2016 Denver Modern Home tour.
File photo
Metropolitan Statistical Area: Denver-Aurora-Lakewood
State: Colorado
Annualized Weekly Wages: $64,337
Percentage of Annualized Wages to Buy: 41.5 percent
Second Quarter 2018 Affordability Index* (Under 100 is Less Affordable Than Historic Average): 76
Second Quarter 2018 Median Sales Price: $358,000
Year-Over-Year Annualized Wage Growth: 3.3 percent
Year-Over-Year Median Home Price Growth: 10.2 percent
National ranking: 8th worst home affordability
County: Adams
Metropolitan Statistical Area: Denver-Aurora-Lakewood
State: Colorado
Annualized Weekly Wages: $53,157
Percentage of Annualized Wages to Buy: 47.3 percent
Second Quarter 2018 Affordability Index* (Under 100 is Less Affordable Than Historic Average): 73
Second Quarter 2018 Median Sales Price: $339,750
Year-Over-Year Annualized Wage Growth: 3.9 percent
Year-Over-Year Median Home Price Growth: 10.5 percent
National ranking: 3rd worst home affordability
County: Denver
Metropolitan Statistical Area: Denver-Aurora-Lakewood
State: Colorado
Annualized Weekly Wages: $67,678
Percentage of Annualized Wages to Buy: 48.1 percent
Second Quarter 2018 Affordability Index* (Under 100 is Less Affordable Than Historic Average): 72
Second Quarter 2018 Median Sales Price: $441,000
Year-Over-Year Annualized Wage Growth: 3.7 percent
Year-Over-Year Median Home Price Growth: 10.3 percent
National ranking: 2nd worst home affordability