

Audio By Carbonatix
Today is Local News Day
A national day of action to support and celebrate the trusted local journalism that strengthens communities. If you believe local news matters — this is the day to show your support. Make a contribution today to help keep our reporting free and accessible to all.
According to the demography office affiliated with the state Department of Local Affairs, Colorado’s growth is slowing substantially, in part because of a downturn in the state’s fertility rate. On average, women in Colorado currently have 1.5 births per lifetime, below the 2.1 births per female resident needed to maintain the present population.
Meanwhile, U.S. Census Bureau statistics show that 47 of Colorado’s 64 counties have fewer females than males. That includes Denver, which was nicknamed “Menver” back in 2006 due to its perceived bounty of single males – although the present 50.1/49.9 percent male-to-female split doesn’t quite justify the moniker. The disparity is much larger in other counties, with the female share of Crowley County’s population at just 26.5 percent.
There’s a reason for this enormous disparity, says state demographer Cindy DeGroen. “The population of Crowley County includes both the population residing in households in addition to those residing in group quarters. There are two types of group quarters: institutional, such as correctional facilities, nursing homes or mental hospitals, and non-institutional, such as college dormitories, military barracks, group homes, missions or shelters. Within Crowley County, almost 50 percent of the total population resides in group quarters, with a majority within a correctional facility that specifically houses males, resulting in a large share of the population being male.” That facility would be the Crowley County Correctional Facility in Olney Springs.
Other explanations for the general ratio of males to females aren’t as straightforward. “We tend to see imbalances due to specific industries or jobs within a community – in Alaska, for example, where primary employment is highly represented by males, including natural resource extraction and the military,” says DeGroen. “As a result, Alaska has a larger number of males as compared to females relative to other states. We also can see imbalances due to the age distribution of a community, as older females tend to outnumber older males given longer life expectancies.”
According to DeGroen, “Population changes as a result of three things: a birth, a death or a mover. We refer to the difference between births and deaths as natural change. When births exceed deaths, it is referred to as natural increase. When deaths exceed births, it is referred to as natural decline.”
The color-coded map below highlights Colorado counties experiencing natural increases or declines from 2010 to 2020. DeGroen points out that “the counties highlighted in shades of blue had a larger number of deaths than births, resulting in natural decline. For the counties in blue, they would need an equal number of movers to keep their population stable, and even more movers to possibly experience growth.”
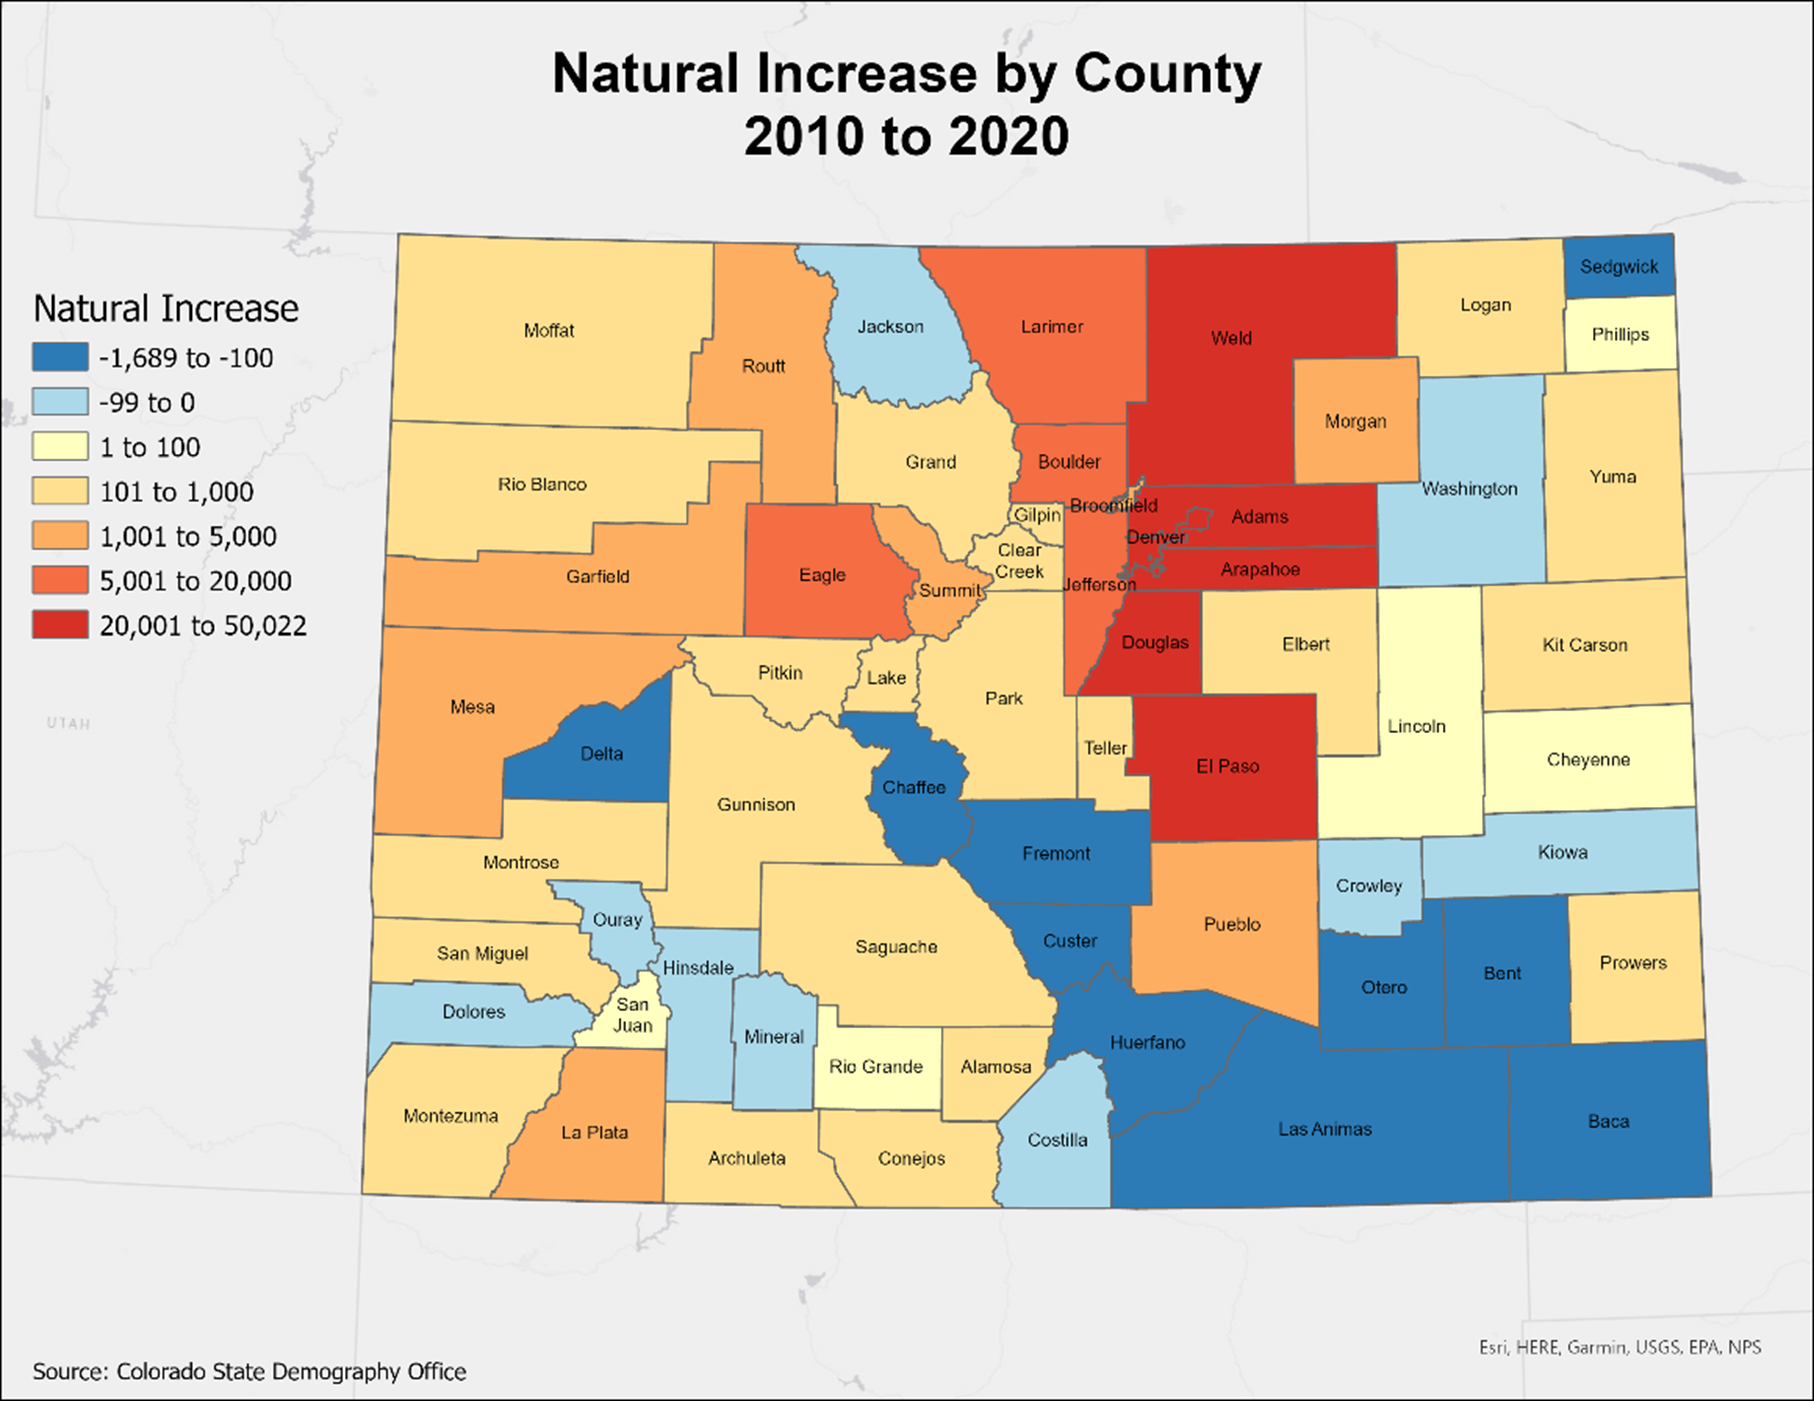
Colorado Department of Local Affairs
Of the seventeen blue-shaded counties on the map, only two, Kiowa and Otero, have more female than male residents. Many of the other fifteen have a much higher percentage of men.
Continue to count down all 64 Colorado counties, ranked from the highest to lowest percentage of female residents. Also included is the percentage of residents under five years of age, under eighteen years of age, and age 65 and older.
1. Kiowa County Age and Sex
Persons under 5 years: 8.1 percent
Persons under 18 years: 23.6 percent
Persons 65 years and over: 23.0 percent
Female persons: 51.1 percent
2 (tie). Otero County
Persons under 5 years: 5.9 percent
Persons under 18 years: 23.9 percent
Persons 65 years and over: 20.7 percent
Female persons: 51.0 percent
2 (tie). Phillips County
Persons under 5 years: 6.0 percent
Persons under 18 years: 24.2 percent
Persons 65 years and over: 23.3 percent
Female persons: 51.0 percent
4. Montrose County
Persons under 5 years: 5.3 percent
Persons under 18 years: 21.2 percent
Persons 65 years and over: 24.1 percent
Female persons: 50.8 percent
5 (tie). Montezuma County
Persons under 5 years: 5.4 percent
Persons under 18 years: 21.6 percent
Persons 65 years and over: 22.9 percent
Female persons: 50.7 percent
5 (tie). Pueblo County
Persons under 5 years: 5.7 percent
Persons under 18 years: 22.2 percent
Persons 65 years and over: 19.0 percent
Female persons: 50.7 percent
7. Mesa County
Persons under 5 years: 5.5 percent
Persons under 18 years: 21.3 percent
Persons 65 years and over: 19.7 percent
Female persons: 50.5 percent
8. Arapahoe County
Persons under 5 years: 6.1 percent
Persons under 18 years: 23.3 percent
Persons 65 years and over: 13.5 percent
Female persons: 50.4 percent
9 (tie). Broomfield County
Persons under 5 years: 5.0 percent
Persons under 18 years: 22.1 percent
Persons 65 years and over: 14.3 percent
Female persons: 50.3 percent
9 (tie). Saguache County
Persons under 5 years: 5.5 percent
Persons under 18 years: 21.1 percent
Persons 65 years and over: 24.5 percent
Female persons: 50.3 percent
9 (tie). Sedgwick County
Persons under 5 years: 4.4 percent
Persons under 18 years: 19.6 percent
Persons 65 years and over: 27.1 percent
Female persons: 50.3 percent
12. Larimer County
Persons under 5 years: 4.9 percent
Persons under 18 years: 19.4 percent
Persons 65 years and over: 16.2 percent
Female persons: 50.2 percent
13 (tie). Alamosa County
Persons under 5 years: 6.3 percent
Persons under 18 years: 24.2 percent
Persons 65 years and over: 13.9 percent
Female persons: 50.1 percent
13 (tie). Jefferson County
Persons under 5 years: 5.1 percent
Persons under 18 years: 19.4 percent
Persons 65 years and over: 16.9 percent
Female persons: 50.1 percent
15 (tie). Douglas County
Persons under 5 years: 5.7 percent
Persons under 18 years: 25.2 percent
Persons 65 years and over: 12.4 percent
Female persons: 50.0 percent
15 (tie). Kit Carson County
Persons under 5 years: 6.1 percent
Persons under 18 years: 25.2 percent
Persons 65 years and over: 19.5 percent
Female persons: 50.0 percent
15 (tie). Rio Grande County
Persons under 5 years: 5.6 percent
Persons under 18 years: 22.4 percent
Persons 65 years and over: 20.9 percent
Female persons: 50.0 percent
18 (tie). Conejos County
Persons under 5 years: 6.1 percent
Persons under 18 years: 25.2 percent
Persons 65 years and over: 19.9 percent
Female persons: 49.9 percent
18 (tie). Denver County
Persons under 5 years: 5.8 percent
Persons under 18 years: 19.1 percent
Persons 65 years and over: 11.9 percent
Female persons: 49.9 percent
18 (tie). Yuma County
Persons under 5 years: 7.5 percent
Persons under 18 years: 27.4 percent
Persons 65 years and over: 18.7 percent
Female persons: 49.9 percent
21. Baca County
Persons under 5 years: 5.4 percent
Persons under 18 years: 22.2 percent
Persons 65 years and over: 24.4 percent
Female persons: 49.8 percent
22 (tie). Delta County
Persons under 5 years: 4.6 percent
Persons under 18 years: 19.6 percent
Persons 65 years and over: 26.8 percent
Female persons: 49.7 percent
22 (tie). Mineral County
Persons under 5 years: 4.0 percent
Persons under 18 years: 14.0 percent
Persons 65 years and over: 33.6 percent
Female persons: 49.7 percent
24 (tie). Archuleta County
Persons under 5 years: 4.4 percent
Persons under 18 years: 17.7 percent
Persons 65 years and over: 27.3 percent
Female persons: 49.6 percent
24 (tie). Boulder County
Persons under 5 years: 4.3 percent
Persons under 18 years: 18.8 percent
Persons 65 years and over: 14.8 percent
Female persons: 49.6 percent
24 (tie). La Plata County
Age and Sex
Persons under 5 years: 4.8 percent
Persons under 18 years: 18.6 percent
Persons 65 years and over: 18.2 percent
Female persons: 49.6 percent
27 (tie). El Paso County
Persons under 5 years: 6.6 percent
Persons under 18 years: 23.8 percent
Persons 65 years and over: 13.2 percent
Female persons: 49.5 percent
27 (tie). Prowers County
Persons under 5 years: 7.2 percent
Persons under 18 years: 25.7 percent
Persons 65 years and over: 18.1 percent
Female persons: 49.5 percent
29 (tie). Adams County
Persons under 5 years: 6.9 percent
Persons under 18 years: 26.1 percent
Persons 65 years and over: 10.7 percent
Female persons: 49.4 percent
29 (tie). Elbert County
Persons under 5 years: 4.4 percent
Persons under 18 years: 21.2 percent
Persons 65 years and over: 17.2 percent
Female persons: 49.4 percent
29 (tie). Weld County
Persons under 5 years: 7.1 percent
Persons under 18 years: 25.9 percent
Persons 65 years and over: 12.4 percent
Female persons: 49.4 percent
32 (tie). Cheyenne County
Persons under 5 years: 6.0 percent
Persons under 18 years: 25.3 percent
Persons 65 years and over: 21.0 percent
Female persons: 49.3 percent
32 (tie). Ouray County
Persons under 5 years: 2.9 percent
Persons under 18 years: 15.3 percent
Persons 65 years and over: 27.3 percent
Female persons: 49.3 percent
32 (tie). Teller County
Persons under 5 years: 3.9 percent
Persons under 18 years: 16.9 percent
Persons 65 years and over: 23.2 percent
Female persons: 49.3 percent
35. Morgan County
Persons under 5 years: 7.4 percent
Persons under 18 years: 25.9 percent
Persons 65 years and over: 15.6 percent
Female persons: 49.0 percent
36 (tie). Garfield County
Persons under 5 years: 6.8 percent
Persons under 18 years: 24.9 percent
Persons 65 years and over: 13.8 percent
Female persons: 48.9 percent
36 (tie). Huerfano County
Persons under 5 years: 3.8 percent
Persons under 18 years: 16.1 percent
Persons 65 years and over: 32.1 percent
Female persons: 48.9 percent
36 (tie). Moffat County
Persons under 5 years: 6.8 percent
Persons under 18 years: 25.4 percent
Persons 65 years and over: 15.9 percent
Female persons: 48.9 percent
39. Rio Blanco County
Persons under 5 years: 6.0 percent
Persons under 18 years: 24.3 percent
Persons 65 years and over: 16.4 percent
Female persons: 48.8 percent
40. Costilla County
Persons under 5 years: 4.8 percent
Persons under 18 years: 19.1 percent
Persons 65 years and over: 26.9 percent
Female persons: 48.6 percent
41 (tie). Hinsdale County
Persons under 5 years: 3.3 percent
Persons under 18 years: 15.0 percent
Persons 65 years and over: 31.5 percent
Female persons: 48.5 percent
41 (tie). Jackson County
Persons under 5 years: 4.6 percent
Persons under 18 years: 16.7 percent
Persons 65 years and over: 23.3 percent
Female persons: 48.5 percent
43. Custer County
Persons under 5 years: 3.5 percent
Persons under 18 years: 13.8 percent
Persons 65 years and over: 33.0 percent
Female persons: 48.3 percent
44, Pitkin County
Persons under 5 years: 3.8 percent
Persons under 18 years: 14.7 percent
Persons 65 years and over: 20.3 percent
Female persons: 48.2 percent
45. Routt County
Persons under 5 years: 4.4 percent
Persons under 18 years: 17.8 percent
Persons 65 years and over: 16.6 percent
Female persons: 48.1 percent
46. Washington County
Persons under 5 years: 5.7 percent
Persons under 18 years: 22.4 percent
Persons 65 years and over: 21.4 percent
Female persons: 47.9 percent
47. Las Animas County
Persons under 5 years: 4.6 percent
Persons under 18 years: 17.9 percent
Persons 65 years and over: 25.4 percent
Female persons: 47.8 percent
48. Dolores County
Persons under 5 years: 3.6 percent
Persons under 18 years: 19.5 percent
Persons 65 years and over: 26.2 percent
Female persons: 47.5 percent
49. Gilpin County
Persons under 5 years: 3.4 percent
Persons under 18 years: 14.6 percent
Persons 65 years and over: 17.8 percent
Female persons: 47.4 percent
50. Park County
Persons under 5 years: 3.7 percent
Persons under 18 years: 15.0 percent
Persons 65 years and over: 21.6 percent
Female persons: 47.3 percent
51 (tie). Eagle County
Persons under 5 years: 5.5 percent
Persons under 18 years: 21.4 percent
Persons 65 years and over: 12.4 percent
Female persons: 47.2 percent
51 (tie). San Miguel County
Persons under 5 years: 4.1 percent
Persons under 18 years: 17.3 percent
Persons 65 years and over: 15.5 percent
Female persons: 47.2 percent
53, Clear Creek County
Persons under 5 years: 3.9 percent
Persons under 18 years: 15.1 percent
Persons 65 years and over: 21.3 percent
Female persons: 47.1 percent
54. Chaffee County
Persons under 5 years: 3.7 percent
Persons under 18 years: 15.1 percent
Persons 65 years and over: 26.0 percent
Female persons: 47.0 percent
55. Grand County
Persons under 5 years: 3.8 percent
Persons under 18 years: 16.7 percent
Persons 65 years and over: 18.5 percent
Female persons: 46.5 percent
56. Lake County
Persons under 5 years: 5.6 percent
Persons under 18 years: 19.8% percent
Persons 65 years and over: 14.6 percent
Female persons: 46.1 percent
57. Gunnison County
Persons under 5 years: 4.1 percent
Persons under 18 years: 16.7 percent
Persons 65 years and over: 13.7 percent
Female persons: 45.9 percent
58. Summit County
Persons under 5 years: 4.6 percent
Persons under 18 years: 16.2 percent
Persons 65 years and over: 14.3 percent
Female persons: 45.3 percent
59. San Juan County
Persons under 5 years: 3.7 percent
Persons under 18 years: 12.5 percent
Persons 65 years and over: 25.8 percent
Female persons: 44.9 percent
60. Logan County
Persons under 5 years: 5.1 percent
Persons under 18 years: 17.9 percent
Persons 65 years and over: 18.1 percent
Female persons: 42.8 percent
61, Fremont County
Persons under 5 years: 4.1 percent
Persons under 18 years: 16.1 percent
Persons 65 years and over: 22.1 percent
Female persons: 42.5 percent
62. Lincoln County
Persons under 5 years: 5.6 percent
Persons under 18 years: 20.4 percent
Persons 65 years and over: 17.6 percent
Female persons: 41.6 percent
63. Bent County
Persons under 5 years: 3.6 percent
Persons under 18 years: 15.4 percent
Persons 65 years and over: 18.9 percent
Female persons: 35.6 percent
64. Crowley County
Persons under 5 years: 2.4 percent
Persons under 18 years: 11.4 percent
Persons 65 years and over: 14.0 percent
Female persons: 26.5 percent
Click to read our three-part series on Colorado growth: “Almost Everything You Think You Know About Colorado Growth Is Wrong,” “Surprising Reasons Why Colorado’s Growth Is Slowing,” and “Why Denver Could Face a Slowing Growth Crisis This Decade.”