

9News via YouTube

Audio By Carbonatix
Crime in Denver typically decreases as summer leads into the fall. But overall offenses in the hardest-hit neighborhoods during a two-week period covering the transition between seasons were actually higher than during an equivalent stretch in July, when crime was supposedly at its hottest.
What’s behind the rise? A closer look at the statistics reveals that violent offenses and property crimes in some Denver neighborhoods actually slid in late September and early October from the peaks of three months ago. But the number of comparatively minor offenses, including ones involving drugs and alcohol, more than made up for the difference, largely spurred by Denver Police Department crackdowns in the heart of the city.
These are among the takeaways from the latest data provided by the DPD’s Denver Crime Map. The online tool divides offenses into three major categories: violent crime (murder, robbery and aggravated assault), property crime (arson, larceny, burglary, auto theft and theft from a motor vehicle) and other crimes (drug-and-alcohol crimes, public disorder, white-collar crime, other crimes against persons and all other crimes). The map also combines totals for all three categories, which are broken down by offenses per square mile in order to allow users to compare neighborhoods that vary widely in size. Accompanying graphics juxtapose the nineteen neighborhoods with the most crimes in each bracket.
During the two-week period from September 19 to October 3, the two areas with the most violent crime were Civic Center (16.4 offenses per square mile) and Union Station (15.9). Both were also atop the violent-crimes roster for the period of July 2-16, but in reverse order, and their totals were lower then: Union Station notched 18.2 offenses per square mile, while Civic Center recorded 16.4. Union Station was also the area with the most property crimes from September 19-October 3, with 100.2 offenses per square mile – considerably lower than the 123 offenses documented for the Central Business District, which topped that category from July 2-16.
In contrast, the “other crimes” per square mile from September 19-October 3 for the three areas – CBD (146.2), Civic Center (138.2) and Union Station (120.7) – dwarf the numbers from July 2-16, when Civic Center led the way with 78.9 offenses per square mile, followed by Union Station at 75.2 and CBD’s 74.2.
Arrests and/or citations for these minor offenses are almost entirely responsible for the higher all-crimes totals. The Central Business District went from 206.5 offenses per square mile this summer to 250.6 during the recent two-week span, with Union Station jumping from 161.7 to 236.9 and Civic Center increasing from 155.8 to 187.5.
Also of note are the large disparities between the first and nineteenth neighborhoods in each category, as exemplified by the all-crimes gap between the CBD’s 250.6 offenses per square mile and Westwood’s 36.7, showing that crime generally drops as you move away from the city center.
Continue to see violent crime, property crime, other crime and overall crime data in Denver from September 19 to October 3 for the nineteen top neighborhoods in each category:
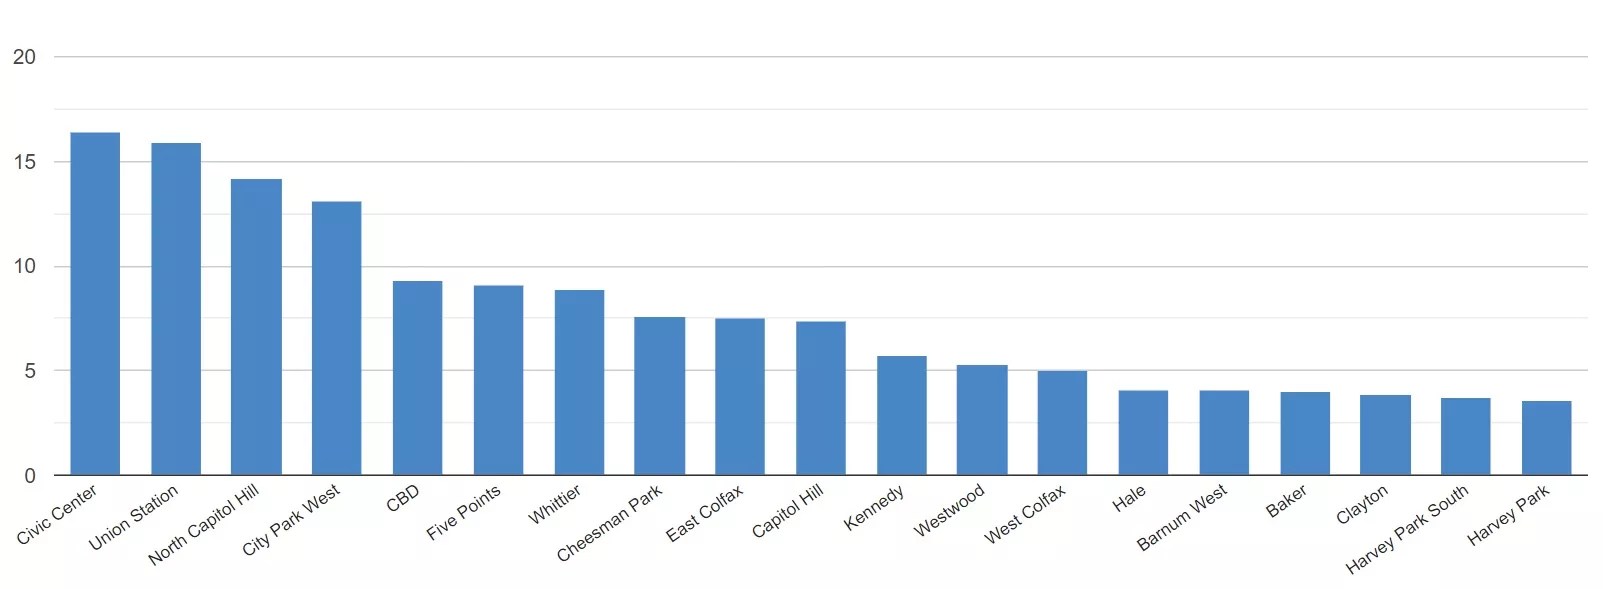
Violent crime, September 19-October 3, 2022
1. Civic Center
16.4 offenses per square mile
2. Union Station
15.9 offenses per square mile
3. North Capitol Hill
14.2 offenses per square mile
4. City Park West
13.1 offenses per square mile
5. CBD (Central Business District)
9.3 offenses per square mile
6. Five Points
9.1 offenses per square mile
7. Whittier
8.9 offenses per square mile
8. Cheesman Park
7.6 offenses per square mile
9. East Colfax
7.5 offenses per square mile
10. Capitol Hill
7.4 offenses per square mile
11. Kennedy
5.7 offenses per square mile
12. Westwood
5.3 offenses per square mile
13. West Colfax
5 offenses per square mile
14 (tie). Hale
4.1 offenses per square mile
14 (tie). Barnum West
4.1 offenses per square mile
16. Baker
4 offenses per square mile
17. Clayton
3.9 offenses per square mile
18. Harvey Park South
3.7 offenses per square mile
19. Harvey Park
3.6 offenses per square mile
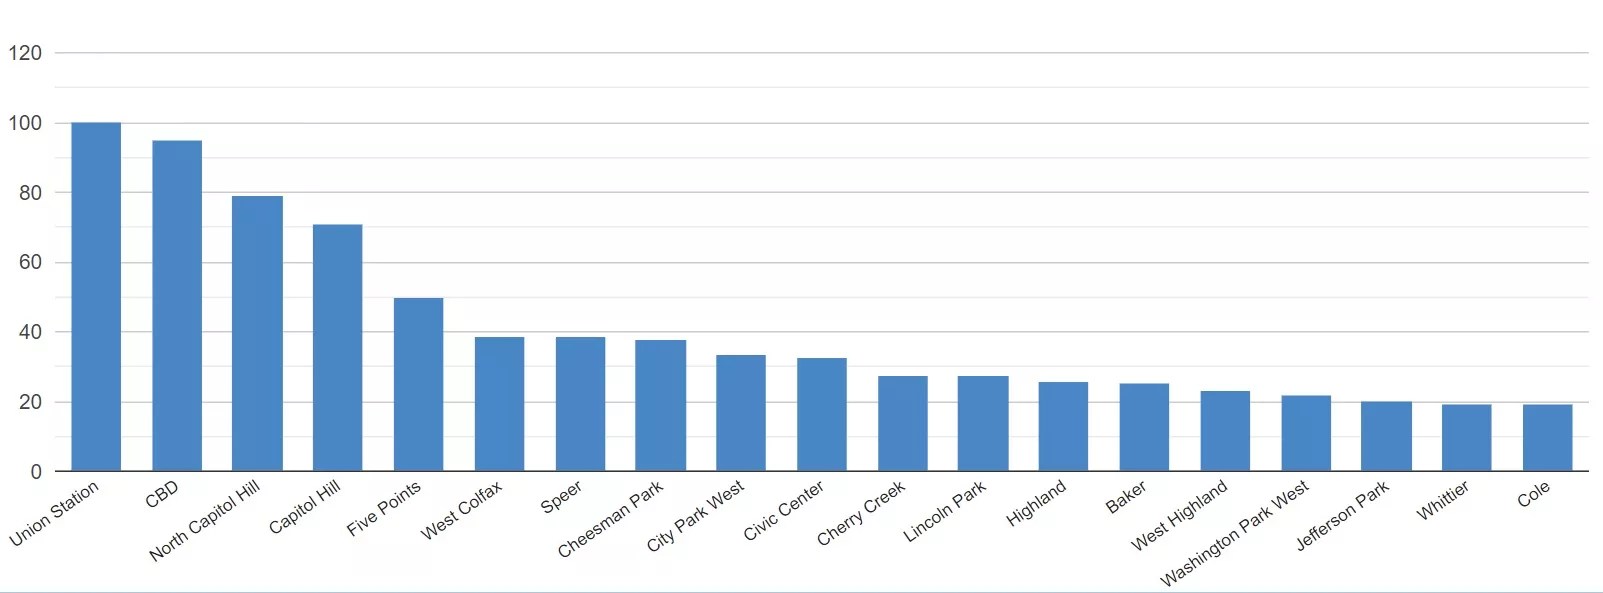
Property Crime, September 19-October 3, 2022
1. Union Station
100.2 offenses per square mile
2. CBD (Central Business District)
95.1 offenses per square mile
3. North Capitol Hill
79.3 offenses per square mile
4. Capitol Hill
71 offenses per square mile
5. Five Points
50.1 offenses per square mile
6. West Colfax
38.8 offenses per square mile
7. Speer
38.6 offenses per square mile
8. Cheesman Park
38 offenses per square mile
9. City Park West
33.6 offenses per square mile
10. Civic Center
32.9 offenses per square mile
11. Cherry Creek
27.5 offenses per square mile
12. Lincoln Park
27.4 offenses per square mile
13. Highland
26 offenses per square mile
14. Baker
25.5 offenses per square mile
15. West Highland
23.2 offenses per square mile
16. Washington Park West
21.8 offenses per square mile
17. Jefferson Park
20.3 offenses per square mile
18 (tie). Cole
19.5 offenses per square mile
18 (tie). Whitter
19.5 offenses per square mile
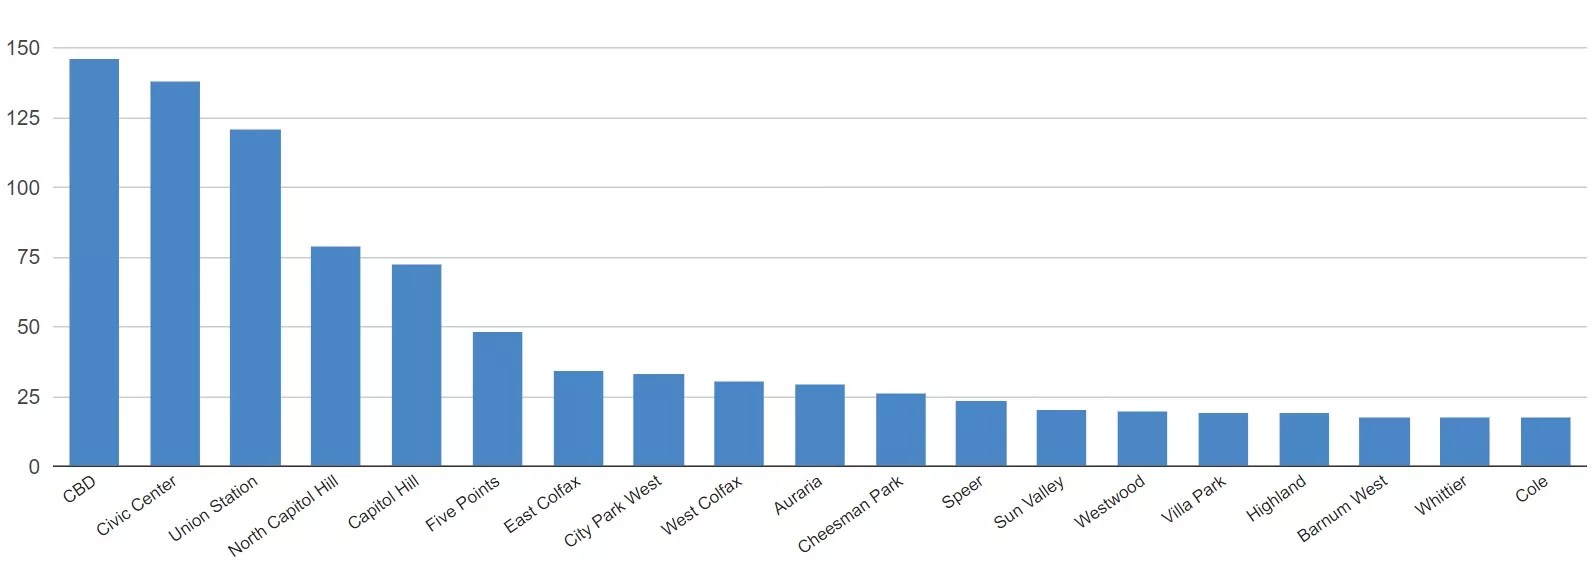
Other crimes, September 19-October 3, 2022
1. CBD (Central Business District)
146.2 offenses per square mile
2. Civic Center
138.2 offenses per square mile
3. Union Station
120.7 offenses per square mile
4. North Capitol Hill
79.3 offenses per square mile
5. Capitol Hill
72.5 offenses per square mile
6. Five Points
48.4 offenses per square mile
7. East Colfax
34.6 offenses per square mile
8. City Park West
33.6 offenses per square mile
9. West Colfax
30.8 offenses per square mile
10. Auraria
29.5 offenses per square mile
11. Cheesman Park
26.6 offenses per square mile
12. Speer
23.4 offenses per square mile
13. Sun Valley
20.2 offenses per square mile
14. Westwood
20 offenses per square mile
15. Villa Park
19.3 offenses per square mile
16. Highland
19.1 offenses per square mile
17. Barnum West
18 offenses per square mile
18. Whittier
17.8 offenses per square mile
19. Cole
17.6 offenses per square mile
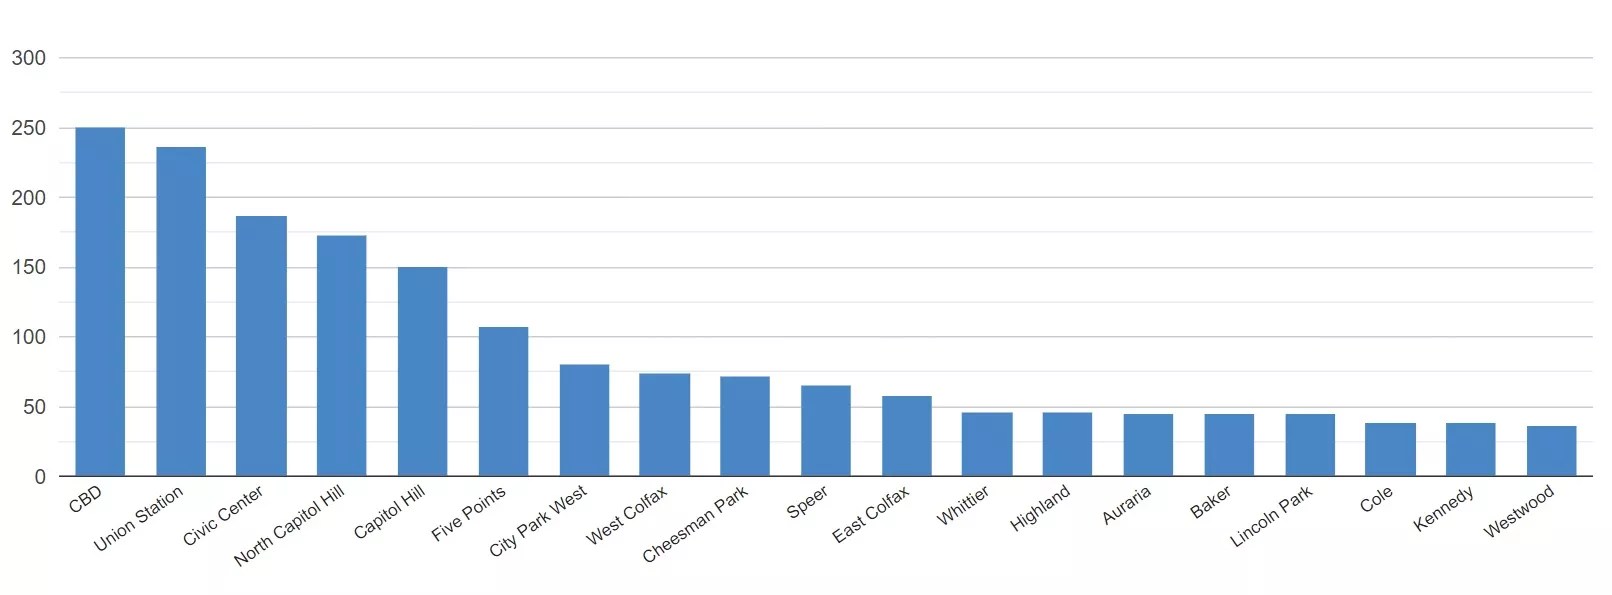
All crime, September 19-October 3, 2022
1. CBD (Central Business District)
250.6 offenses per square mile
2. Union Station
236.9 offenses per square mile
3. Civic Center
187.5 offenses per square mile
4. North Capitol Hill
172.8 offenses per square mile
5. Capitol Hill
150.9 offenses per square mile
6. Five Points
107.5 offenses per square mile
7. City Park West
80.4 offenses per square mile
8. West Colfax
74.6 offenses per square mile
9. Cheesman Park
72.1 offenses per square mile
10. Speer
65.6 offenses per square mile
11. East Colfax
58 offenses per square mile
12. Whittier
46.2 offenses per square mile
13. Highland
46 offenses per square mile
14. Auraria
45 offenses per square mile
15. Baker
44.9 offenses per square mile
16. Lincoln Park
44.7 offenses per square mile
17. Cole
39.1 offenses per square mile
18. Kennedy
38.5 offenses per square mile
19. Westwood
36.7 offenses per square mile