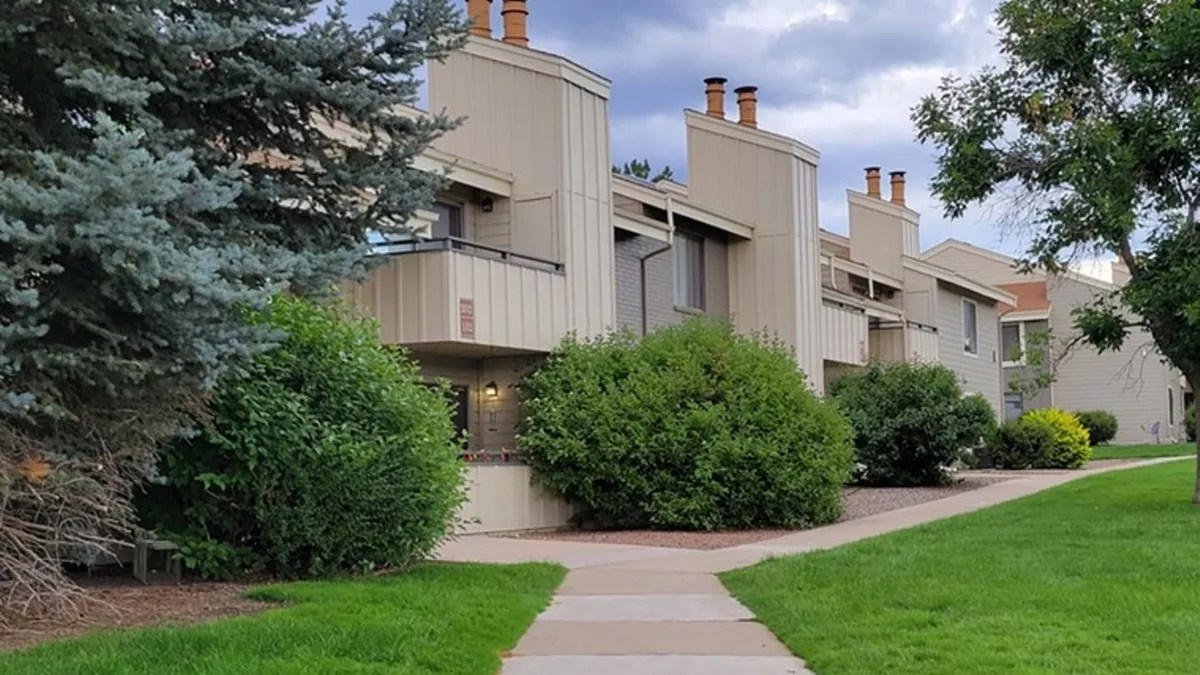
Photo by Anna Slavens

Audio By Carbonatix
While there are indications that the Denver real-estate scene is trending toward a buyer’s market, the average cost of a home in the metro area increased again last month – and costs remain prohibitive for plenty of people who’d like purchase a place of their own.
These factors help explain why a dozen Denver zip codes – more than a quarter of the 41 whose lines are partly or entirely within city limits – have more renters than homeowners, including three that have shifted in that direction over the past decade.
The information is provided by RentCafé, which published a recent study that looks at the subject from a national perspective. Author Andrea Neculae notes that renting in the U.S. is at its highest level in a half-century, with 43.7 million households currently residing in rental units. The U.S. Census Bureau‘s 2020 survey found that the number of American renters rose by 12 percent over the previous decade, while homeowners increased only by 4 percent.
Today, renters represent the majority in 41 percent of the 1,553 zip codes in the fifty largest U.S. cities, including Denver. Neculae also determined that renters had switched from the minority to the majority of residents in 101 zip codes across the country from 2011-2020.
Included on that list are three zip codes in metro Denver. Here are more details provided to Westword by RentCafé, as well as links to maps and more information:
80237 (Includes parts of Greenwood Village, Aurora and Cherry Hills Village)
Renter share 2011: 37.80 percent
Renter share 2020: 50.70 percent
Renters in 2011: 6,470
Renters in 2020: 11,023
Percentage change: 70.40 percent80247 (Includes parts of the Windsor neighborhood)
Renter share 2011: 38.80 percent
Renter share 2020: 67.60 percent
Renters in 2011: 15,551
Renters in 2020: 20,493
Percentage change: 31.80 percent80222 (Includes parts of Denver and Cherry Hills Village)
Renter share 2011: 44.70 percent
Renter share 2020: 51.90 percent
Renters in 2011: 8,446
Renters in 2020: 12,416
Percentage change: 47 percent
In addition to these zip codes, RentCafé cites three others in Denver where the percentage of renters is growing the fastest:
80202 (Includes much of downtown and the area around Union Station)
Renter share 2011: 68.30 percent
Renter share 2020: 73 percent
Renters in 2011: 6,185
Renters in 2020: 11,214
Percentage change: 81.30 percent80216 (Includes parts of the Elyria-Swansea and Globeville neighborhoods)
Renter share 2011: 52.80 percent
Renter share 2020: 60.90 percent
Renters in 2011: 5,212
Renters in 2020: 8,244
Percentage change: 58.20 percent80205 (Includes parts of the Cole and Whittier neighborhoods)
Renter share 2011: 88.40 percent
Renter share 2020: 90.80 percent
Renters in 2011: 13,499
Renters in 2020: 18,691
Percentage change: 38.50 percent
The six zip codes above are among the twelve in Denver with more renters than homeowners. Here’s the complete countdown, in descending order:
1. 80205
Renters in 2020: 18,691
Renter share 2020: 90.80 percent2. 80203 (Includes parts of the Speer neighborhood)
Renters in 2020: 16,045
Renters share 2020: 76.30 percent3. 80246 (Includes parts of Glendale)
Renters in 2020: 9,856
Renters share 2020: 74.304. 80202
Renters in 2020: 11,214
Renters share 2020: 73 percent5. 80247
Renters in 2020: 20,493
Renters share 2020: 67.60 percent6. 80214 (Includes parts of Edgewater)
Renters in 2020: 15,587
Renters share 2020: 62.30 percent7. 80231 (Includes parts of the Washington, Virginia Vale and Indian Creek neighborhoods)
Renters in 2020: 22,405
Renters share 2020: 62.30 percent8. 80216
Renters in 2020: 8,244
Renters share 2020: 60.90 percent9. 80218 (Includes parts of the Cheesman Park neighborhood)
Renters in 2020: 11,167
Renters share 2020: 60.30 percent10. 80204 (Includes parts of the West Colfax and Villa Park neighborhoods)
Renters in 2020: 19,778
Renters share 2020: 58.80 percent11. 80222
Renters in 2020: 12,416
Renters share 2020: 51.90 percent12. 80237
Renters in 2020; 11,023
Renters share 2020: 50.70 percent
Click to read “Renting Out the Neighborhood: 101 Zip Codes Switch From Homeowner to Renter Majority.”