On numerous occasions over the years, we've posted about the most dangerous intersections in Denver — but typically, our data was compiled from previously published sources.
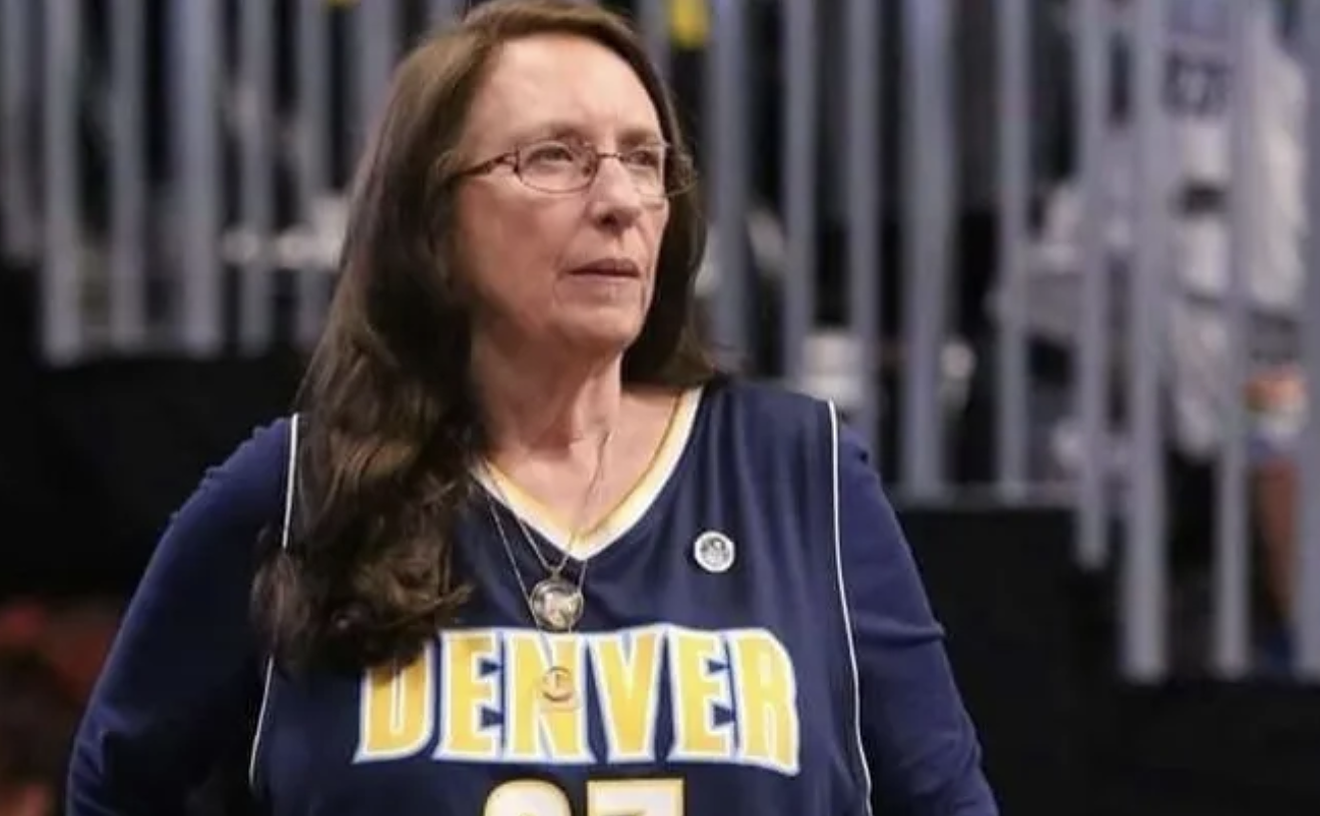
This time around, we reached out to the Denver Police Department and asked Mary Dulacki and her team in the records unit to pull together the latest data.
The DPD numbers compare figures from the first five months of 2016 with the same time span last year. The result is a list of the intersections with the most traffic accidents during both periods combined.
As you'll see, some thoroughfares are more prone to accidents than others. In fact, six of the top ten are evenly split between different locations along two streets. Meanwhile, the number of accidents at the riskiest intersection went up a disturbing 136 percent from 2015 to 2016.
Continue to check out the photo-illustrated roster, which should serve as a reminder about where drivers need to be even more cautious than usual.
Number 11: Colfax and Colorado
Accidents between January 1 and May 31, 2015: 5
Accidents between January 1 and May 31, 2016: 6
Total: 11
Percent change: 20 percent
Number 10 (tie): 36th and Quebec
Accidents between January 1 and May 31, 2015: 7
Accidents between January 1 and May 31, 2016: 6
Total: 13
Percent change: -14.3 percent
Number 10 (tie): Lowry and Yosemite
Accidents between January 1 and May 31, 2015: 6
Accidents between January 1 and May 31, 2016: 7
Total: 13
Percent change: 16.7 percent
Number 8: 17th and Colorado
Accidents between January 1 and May 31, 2015: 9
Accidents between January 1 and May 31, 2016: 7
Total: 16
Percent change: -22.2 percent
Number 7: Colfax and Kalamath/Santa Fe
Accidents between January 1 and May 31, 2015: 10
Accidents between January 1 and May 31, 2016: 11
Total: 21
Percent change: 10 percent
Continue to keep counting down Denver's eleven most dangerous intersections.
Number 6 (tie): Santa Fe and Alameda
Accidents between January 1 and May 31, 2015: 15
Accidents between January 1 and May 31, 2016: 11
Total: 26
Percent change: -26.7 percent
Number 6 (tie): Federal and Evans
Accidents between January 1 and May 31, 2015: 13
Accidents between January 1 and May 31, 2016: 13
Total: 26
Percent change: 0 percent
Number 4: Mississippi and Federal
Accidents between January 1 and May 31, 2015: 17
Accidents between January 1 and May 31, 2016: 10
Total: 27
Percent change: -41.2 percent
Number 3: Monaco and Colfax
Accidents between January 1 and May 31, 2015: 14
Accidents between January 1 and May 31, 2016: 14
Total: 28
Percent change: 0 percent
Number 2: Federal and Alameda
Accidents between January 1 and May 31, 2015: 14
Accidents between January 1 and May 31, 2016: 15
Total: 29
Percent change: 7.1 percent
Number 1: MLK and Quebec
Accidents between January 1 and May 31, 2015: 11
Accidents between January 1 and May 31, 2016: 26
Total: 37
Percent change: 136.4 percent
[
        {
          "name": "Air - MediumRectangle - Inline Content - Mobile Display Size",
          "component": "12017618",
          "insertPoint": "2",
          "requiredCountToDisplay": "2"
        },{
          "name": "Editor Picks",
          "component": "17242653",
          "insertPoint": "4",
          "requiredCountToDisplay": "1"
        },{
          "name": "Inline Links",
          "component": "18838239",
          "insertPoint": "8th",
          "startingPoint": 8,
          "requiredCountToDisplay": "7",
          "maxInsertions": 25
        },{
          "name": "Air - MediumRectangle - Combo - Inline Content",
          "component": "17261320",
          "insertPoint": "8th",
          "startingPoint": 8,
          "requiredCountToDisplay": "7",
          "maxInsertions": 25
        },{
          "name": "Inline Links",
          "component": "18838239",
          "insertPoint": "8th",
          "startingPoint": 12,
          "requiredCountToDisplay": "11",
          "maxInsertions": 25
        },{
          "name": "Air - Leaderboard Tower - Combo - Inline Content",
          "component": "17261321",
          "insertPoint": "8th",
          "startingPoint": 12,
          "requiredCountToDisplay": "11",
          "maxInsertions": 25
        }
      ]

BEFORE YOU GO...
Can you help us continue to share our stories? Since the beginning, Westword has been defined as the free, independent voice of Denver — and we'd like to keep it that way. Our members allow us to continue offering readers access to our incisive coverage of local news, food, and culture with no paywalls.
Can you help us continue to share our stories? Since the beginning, Westword has been defined as the free, independent voice of Denver — and we'd like to keep it that way. Our members allow us to continue offering readers access to our incisive coverage of local news, food, and culture with no paywalls.


Trending


Use of this website constitutes acceptance of our
terms of use,
our cookies policy, and our
privacy policy
Westword may earn a portion of sales from products & services purchased through links on our site from our
affiliate partners.
©2024
Denver Westword, LLC. All rights reserved.
Do Not Sell or Share My Information
Do Not Sell or Share My Information
